7 testo 816-1 software
27
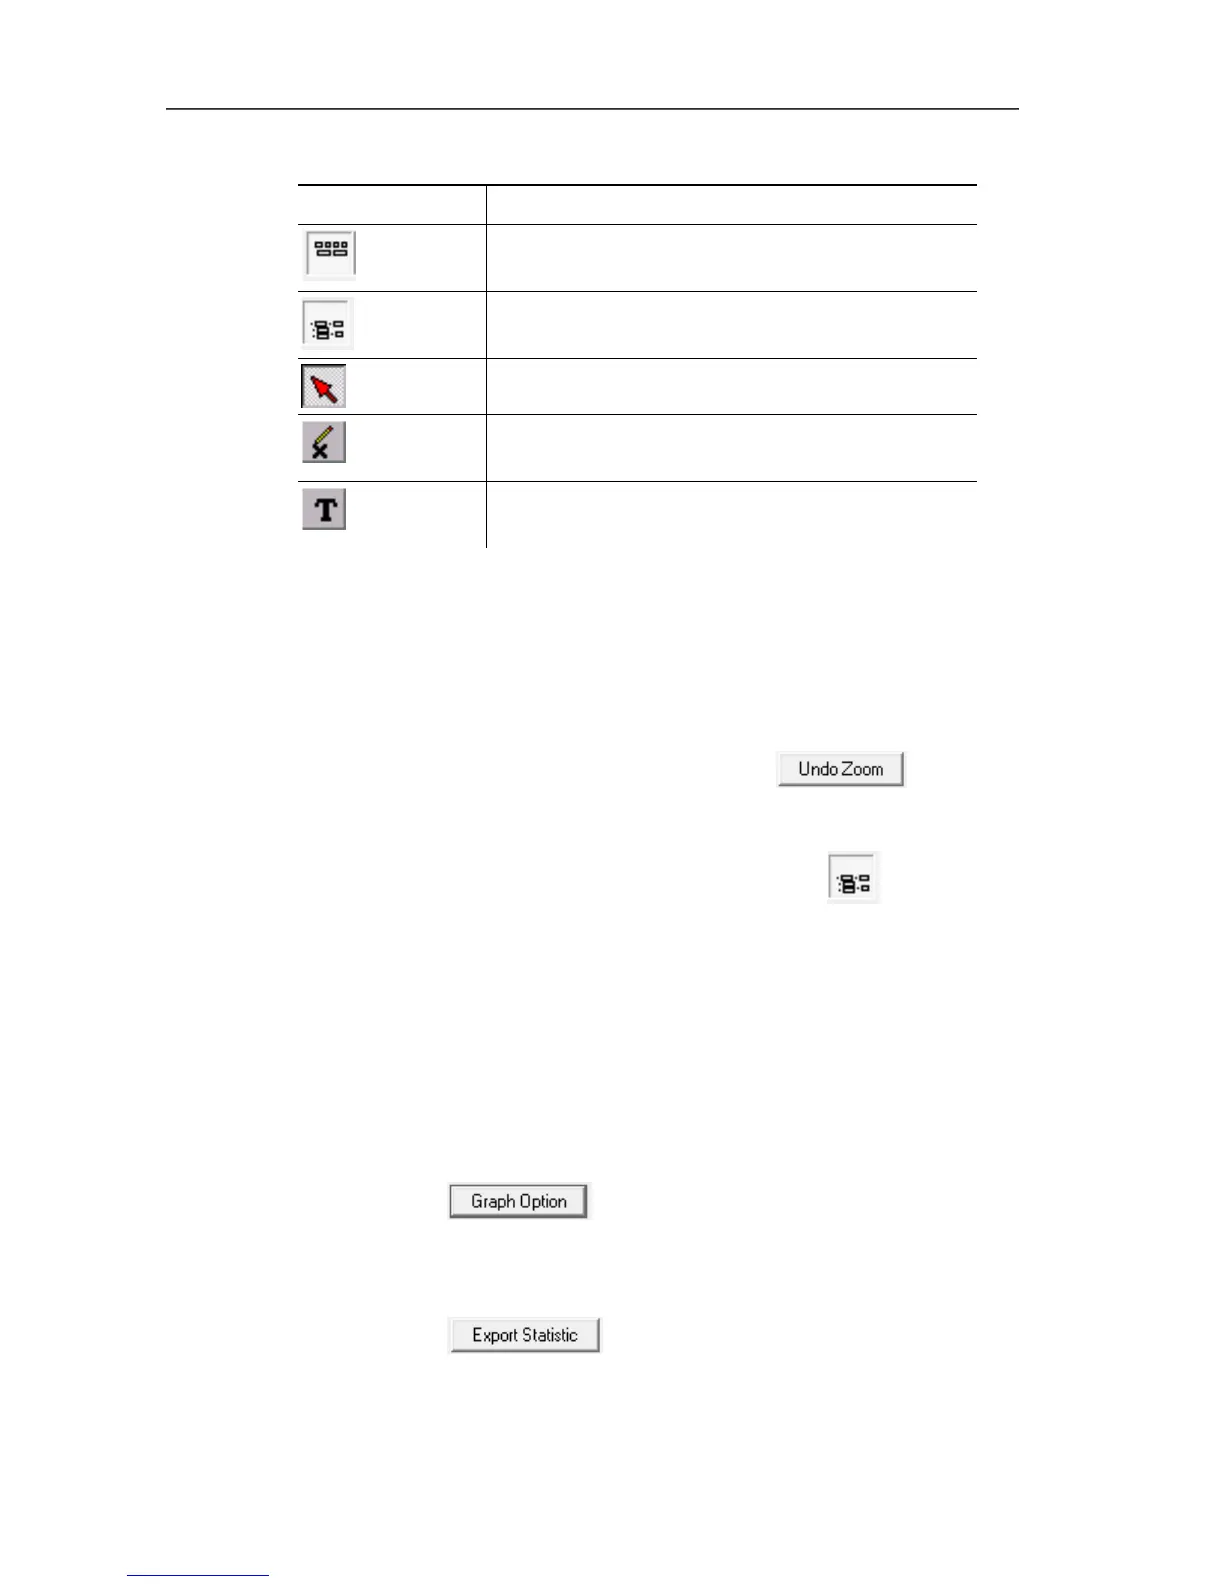
Function bar
Function Description
Show / hide bar for displaying the recording
information.
Show / hide bar for displaying the evaluation
information.
Standard mouse cursor.
Mouse cursor for inserting a cross in the
graph.
Mouse cursor for inserting a comment in the
graph.
Zoom
1. Activate standard mouse cursor.
2. Click in the graph and draw a rectangle by holding down and
dragging your mouse.
- The selected graph area is displayed.
3. To return to the standard view, press the button.
Displaying individual readings / evaluating the time period
The bar for displaying the evaluation information ( ) must be
shown.
> Move both slide controls (green) below the graph.
- A blue line (cursor A) and a red line (cursor B) are displayed
together with reading and time at the selected position.
- Maximum / minimum reading and time are displayed in the
selected area A-B.
- The average reading is displayed in the selected area A-B.
Adjusting graph properties
> Press the button.
- A window opens for adjusting the graph settings.
Exporting recorded readings
1. Press the button.
- The readings are copied to the clipboard.
2. Open program into which the data is to be exported
(e.g. Microsoft® Excel®) and paste in data.