EasyManuals Logo

Texas Instruments TI-82 STATS Getting Started

Texas Instruments TI-82 STATS
58 pages
To Next Page IconTo Next Page
To Previous Page IconTo Previous Page
Page #26 background imageLoading...
Page #26 background image
22
Graphing a function (continued)
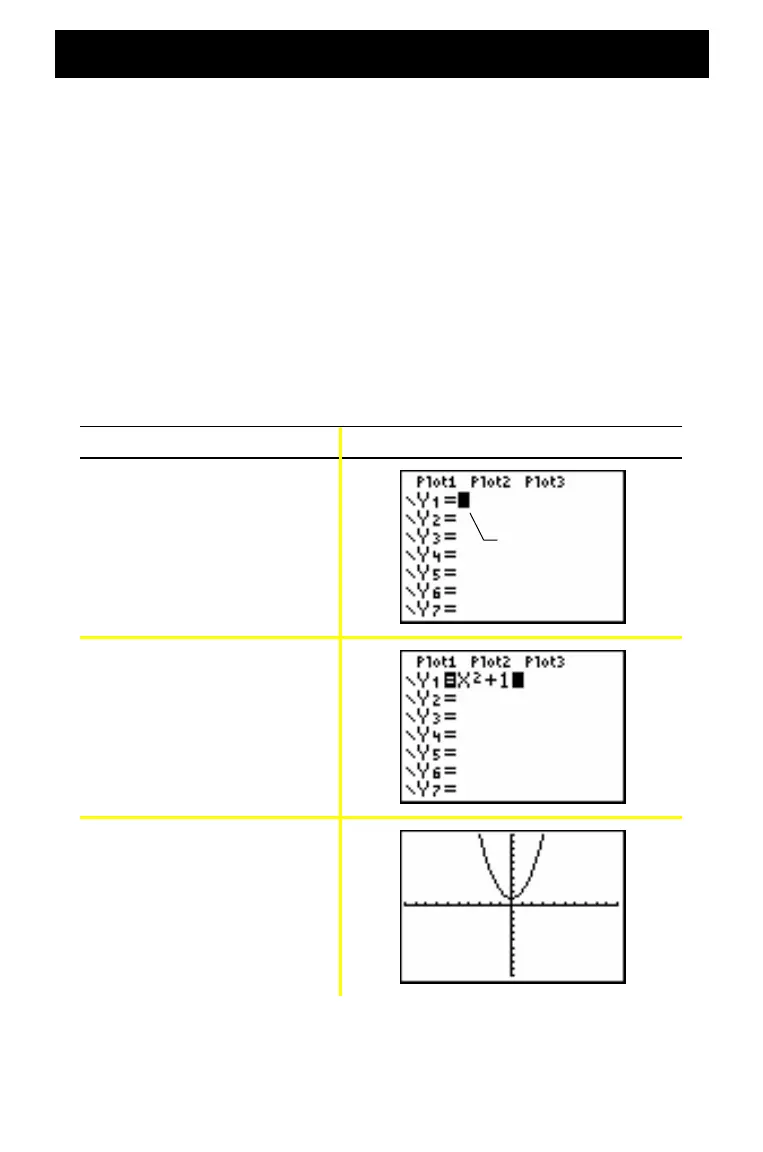
To graph a function, you must:
1. Display the Y= Editor.
2. Enter the function.
3. Display the graph.
Note: If you previously changed graph type in the mode settings, you must
change the type back to Func (the default setting) before you graph.
Example: Graph the function Y = X
2
+ 1.
Press Result
o
¡ Ã 1
s
Note: If Y1 is not empty, press
. If there are additional entries in
the Y= Editor, press
until all are clear.
For more details,
see Guidebook
Chapter 3.
If Y1 is not
blank, see
Note.

Other manuals for Texas Instruments TI-82 STATS

Questions and Answers:

Question and Answer IconNeed help?

Do you have a question about the Texas Instruments TI-82 STATS and is the answer not in the manual?

Texas Instruments TI-82 STATS Specifications

General IconGeneral
TypeGraphing Calculator
DisplayLCD
Resolution96 x 64 pixels
Characters16 x 8
ProcessorZilog Z80
ProgrammingTI-BASIC
Memory28 KB RAM
Power4 AAA batteries
ConnectivityLink port

Related product manuals