26
Setting the graphing window
To obtain the best view of the graph, you may
need to change the boundaries of the window.
To display the WINDOW Editor, press p
.
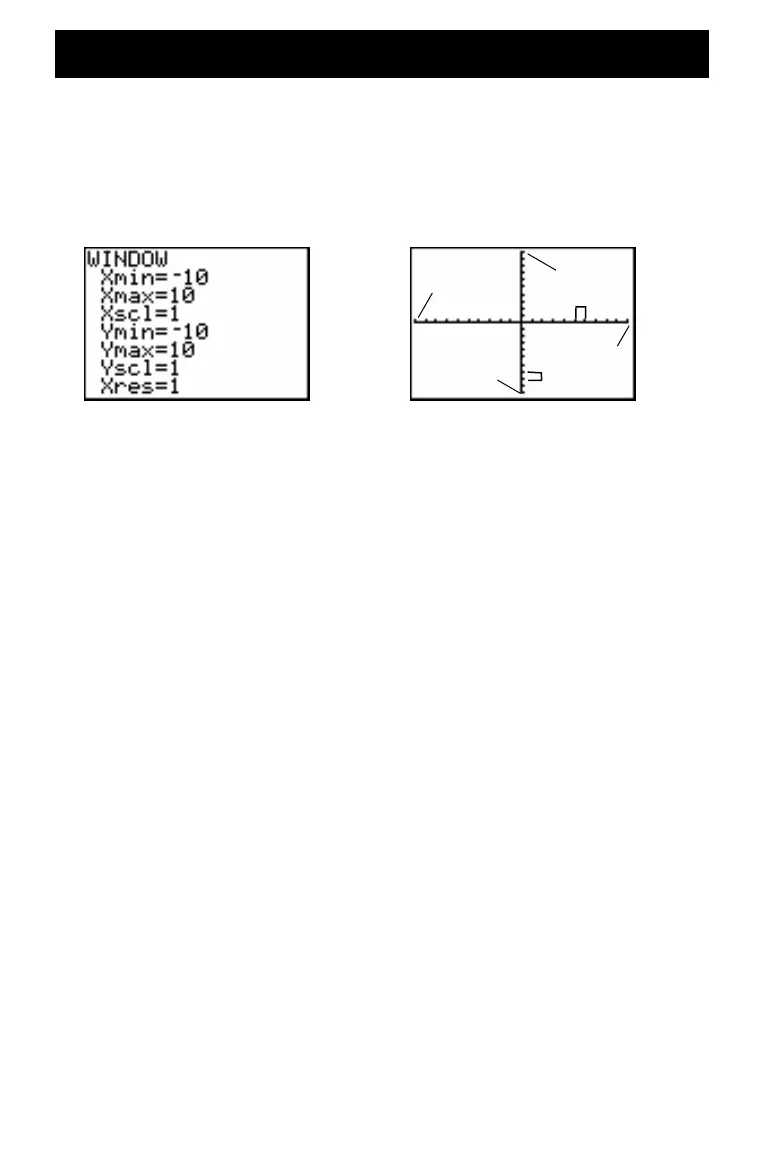
Window variables
(shown in WINDOW Editor)
Corresponding viewing window
(shown on Graph window)
The Xmin, Xmax, Ymin, and Ymax variables represent the
boundaries of the viewing window.
Xmin
: the minimum value of X to be displayed.
Xmax: the maximum value of X to be displayed.
Ymin: the minimum value of Y to be displayed.
Ymax: the maximum value of Y to be displayed.
Xscl (X scale): the distance between the tick marks on the X axis.
Yscl (Y scale): the distance between the tick marks on the Y axis.
Xres: pixel resolution—not usually changed except by advanced
users.
To change the values:
1. Move the cursor to highlight the value you want to change.
2. Do one of the following:
• Type a value or an expression. The old value is erased
when you begin typing.
— or —
• Press ‘ to clear the old value; then type the new one.
3. Press Í, †, or }.
Xmin
Ymin
Ymax
Xmax
Xscl
Yscl
For more details,
see Guidebook
Chapter 3.

 Loading...


