27
Setting the graphing window (continued)
Note: Values are stored as you type them; you do not need to press
Í
. Pressing
Í
simply moves the cursor to the next
window variable.
4. After you have made all changes, press y 5 to close the
WINDOW Editor (or s to display the graph).
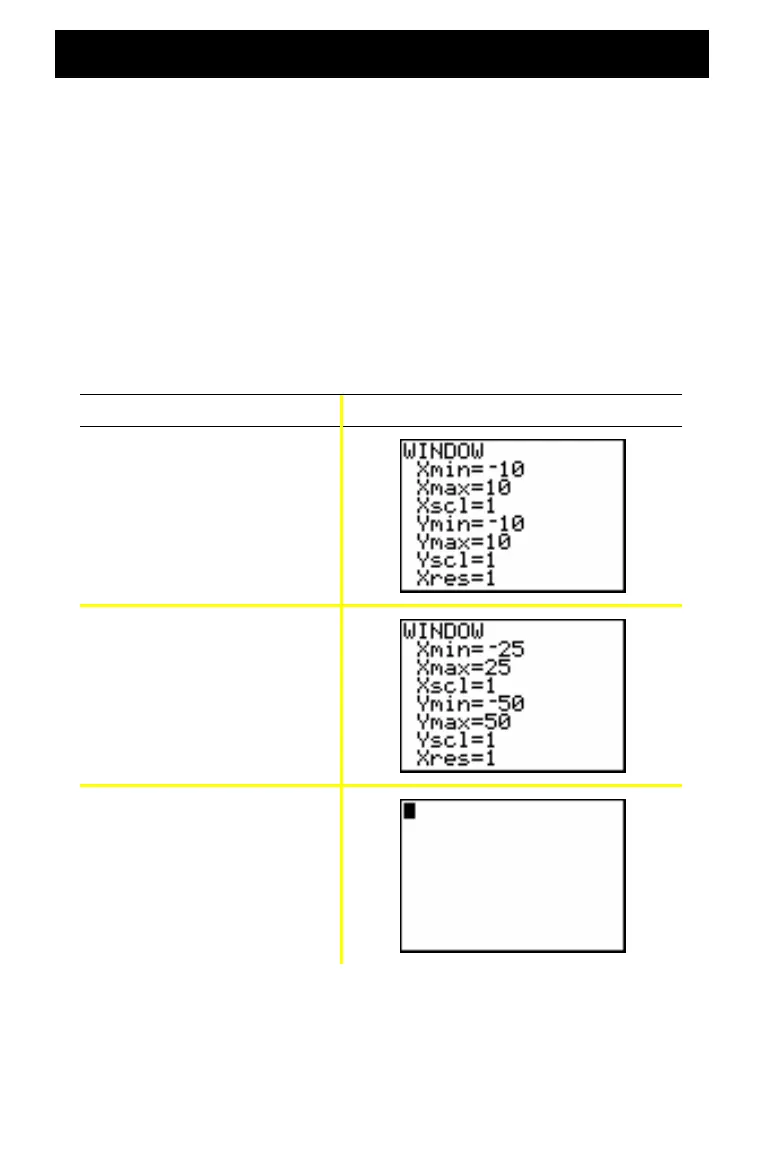
Example: Change the window settings to display a maximum
X value of 25, a minimum X value of L25, a maximum
Y value of 50, and a minimum Y value of L50.
Press Result
p
Ì 2 5 † 2 5 † †
Ì
5 0 † 5 0
y 5

 Loading...


