39
Plotting data
When you have statistical data stored in lists,
you can display the data you have collected in
a scatter plot, xyLine, histogram, box plot, or
normal probability plot.
You will need to:
1. Determine which lists contain your data.
2. Tell the calculator which lists of data you want to plot
and define the plot.
3. Display the plot.
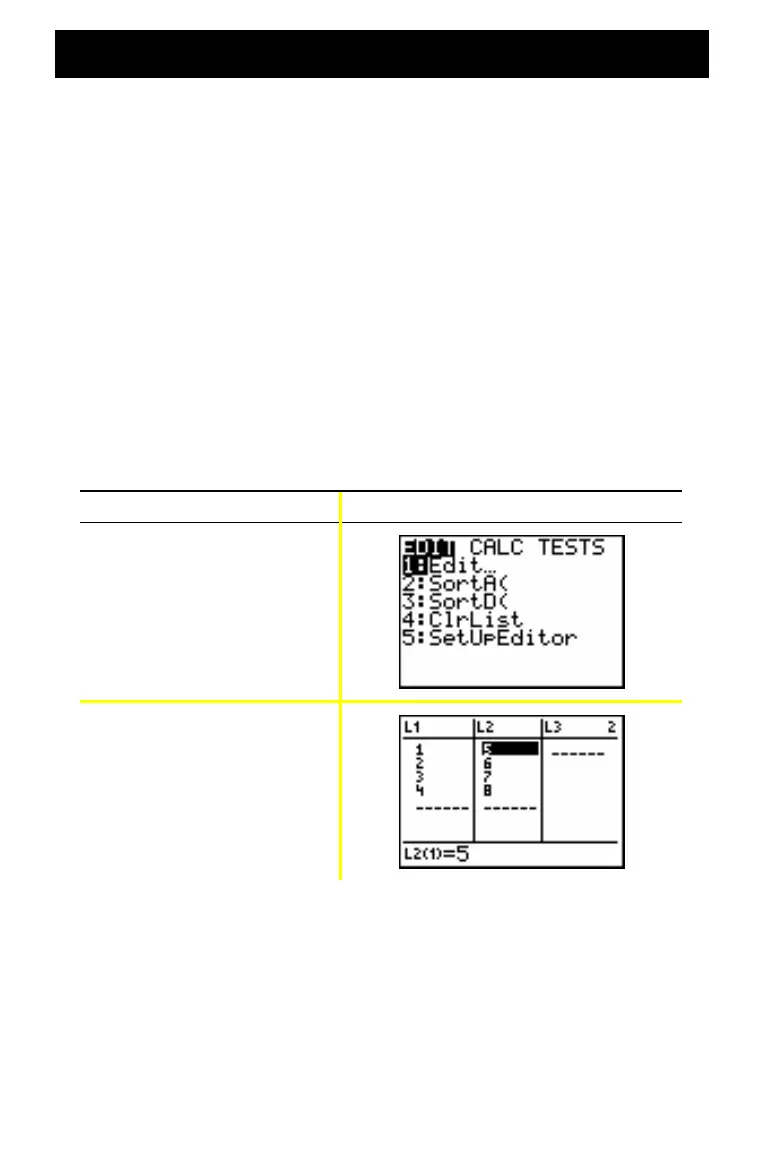
Determine which lists contain your data
Press Result
…
Í
Note: In some cases, you may have several lists stored and you may have
to press
~
several times to find the correct lists.
For more details,
see Guidebook
Cha
ter 12.

 Loading...


