48 Calculator Keystroke Guide
The second shading method, the Shade command, provides for more control over how and
where the shading takes place. It can also be used to shade a part of the graphing window between
two graphs, or between a graph and a given constant value of y. The direction and density of the
shading can also be specified, and the shading can be restricted to appear between two given
values of x. The Shade command asks for at least 2 and up to 6 pieces of information to produce
the kind of shading you want. The information is entered in the following form. First, there is the
Shade command itself, followed by the minimum two pieces of information and as many as four
more optional pieces of information, enclosed in parentheses and separated by commas:
Shade(lower function, upper function, beginning x, ending x, pattern, shading density)
↑ ↑ ↑ ↑ ↑ ↑
required required optional optional optional optional
lower function = function or constant value of y you want at the bottom of the shaded region
upper function = function or constant value of y you want at the top of the shaded region
beginning x = (optional) smallest value of x for which you want to have shading
ending x = (optional) largest value of x for which you want to have shading
pattern = (optional) direction of the shading (vertical = 1 [default], horizontal = 2, diagonal upper
left to lower right = 3, diagonal lower left to upper right = 4)
shading density = (optional) how densely you want the shading to occur (solid = 1 [default] to
least = 8)
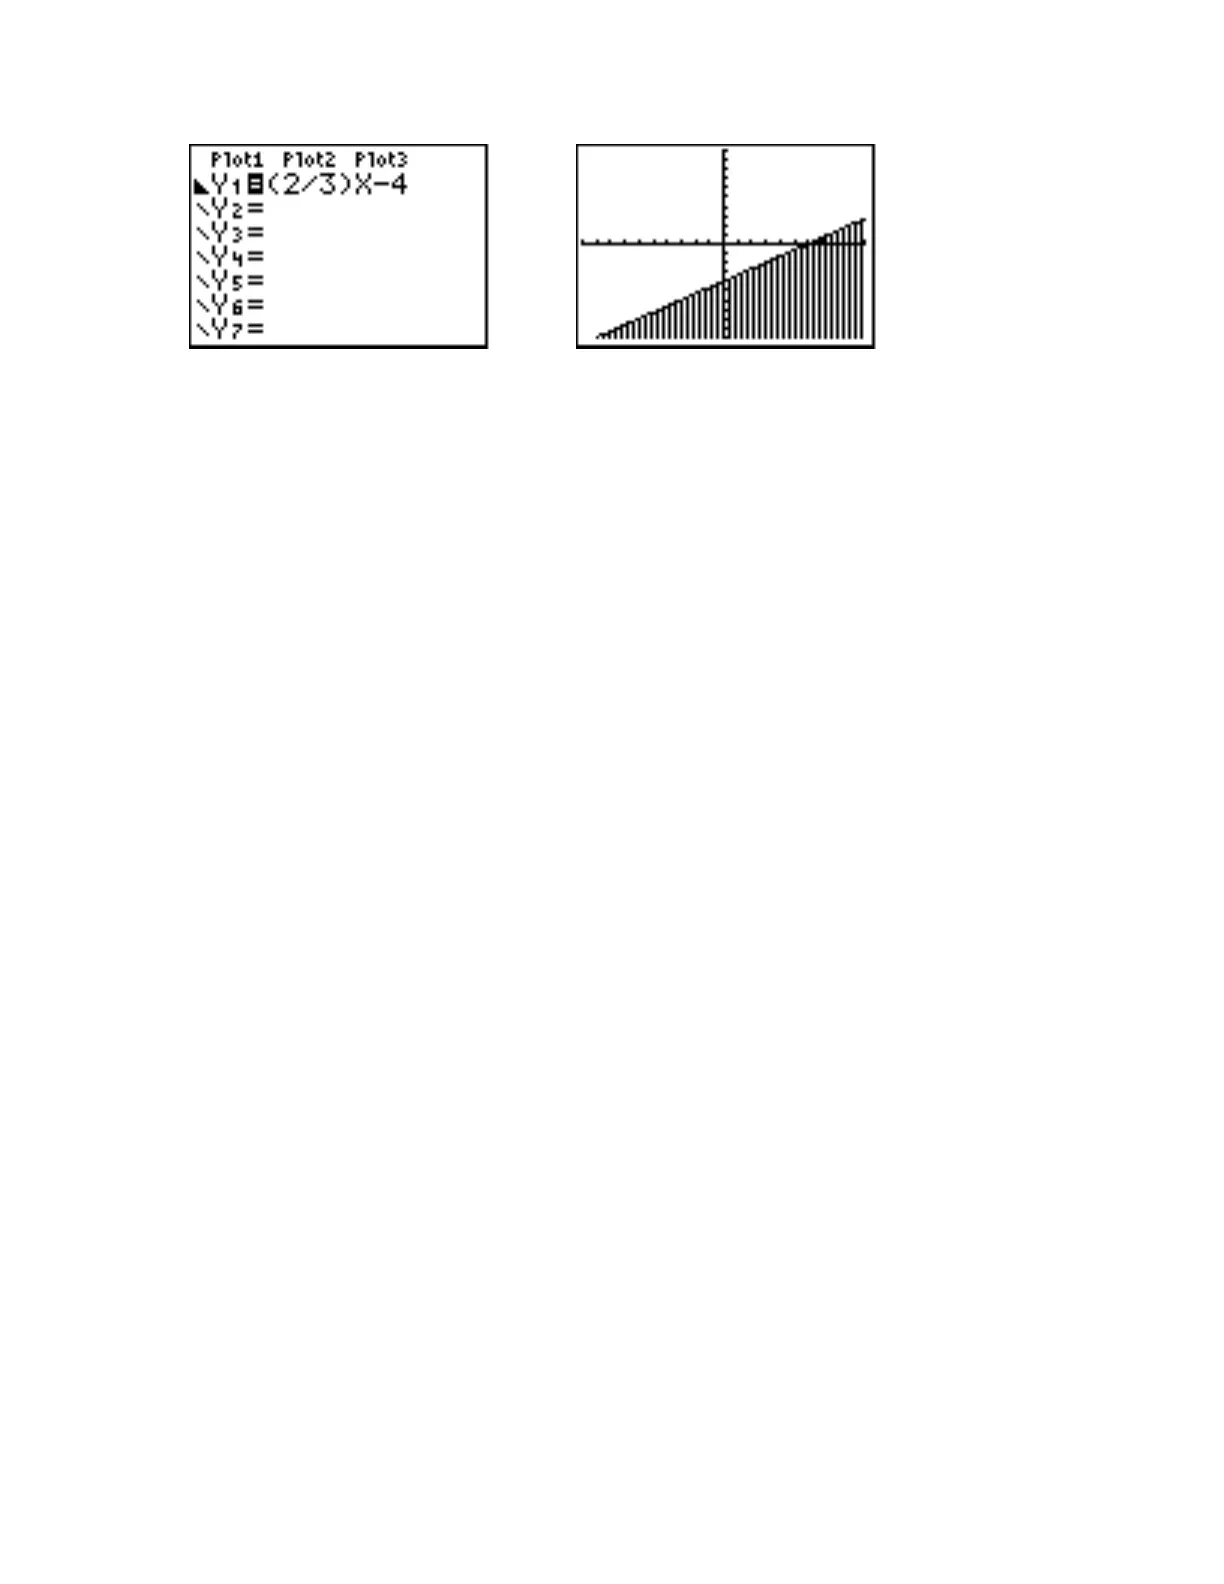
All of this may look rather complicated, but working through the example again will probably
help. To see how to do the shading with the Shade command, go to the Y= screen, highlight the
styles feature for Y1, and keep pressing ENTER until the standard thin diagonal line reappears.
Then press 2nd [QUIT] to return to the Home screen. As was noted earlier, the solution of the
inequality consists of all points on or below the graph of the equation, since the values of y must
be less than (below) or equal to (on) the values of y on the graph for each value of x. Therefore,
the graph of the equation will form the top of the shaded region indicating the solution of the
inequality. Thus, Y1 will be your upper function on the Shade command. All points below the graph
of Y1 are part of the solution of the inequality, so there really is no bottom to the shaded region.
For the purposes of the Shade command, you want the shading to go to the bottom of the graphing
window, so you can use any number below the lowest value of y displayed, Ymin, as the lower
function. Really, lower function and upper function are the only two quantities needed to do a basic
shading. At the Home screen press 2nd [DRAW] to display the general DRAW menu. Press 7 to
display the Shade( command on the Home screen. Note that the Shade( command automatically
displays an open parenthesis to save you a bit of typing. The first thing you must enter is the lower
function. Since the lowest value of y in the Standard viewing window (Ymin) is −10, type in
anything less, such as −11. At the Home screen you should now see Shade(-11. Before you

 Loading...


