TI-83 49
enter the upper function, you must type in a comma to separate it from the lower function. (The
comma key is just above the 7 key.) The upper function is Y1, so press VARS, highlight the Y-VARS
menu heading, press ENTER to choose the Function... menu, and then press 1 or ENTER to choose
Y1. Type a close parenthesis at the end to complete the command. At the Home screen you should
now see Shade(-11,Y1). Press ENTER to execute the Shade command. The calculator should
display the graph with solid shading below the line.
If you want to erase this shading, press 2nd [DRAW] and then choose 1 (ClrDraw). If you select
this command from the Home screen, the command ClrDraw (Clear Drawing) will be displayed at
the Home screen. Press ENTER to execute the command. The calculator will respond with the
word Done. Press GRAPH to verify that the shading has been erased. If you have done some
shading and are viewing the Graph screen when you select the ClrDraw command (2nd [DRAW], 1),
the calculator will immediately return to the Graph screen and redraw the graphs without the
shading.
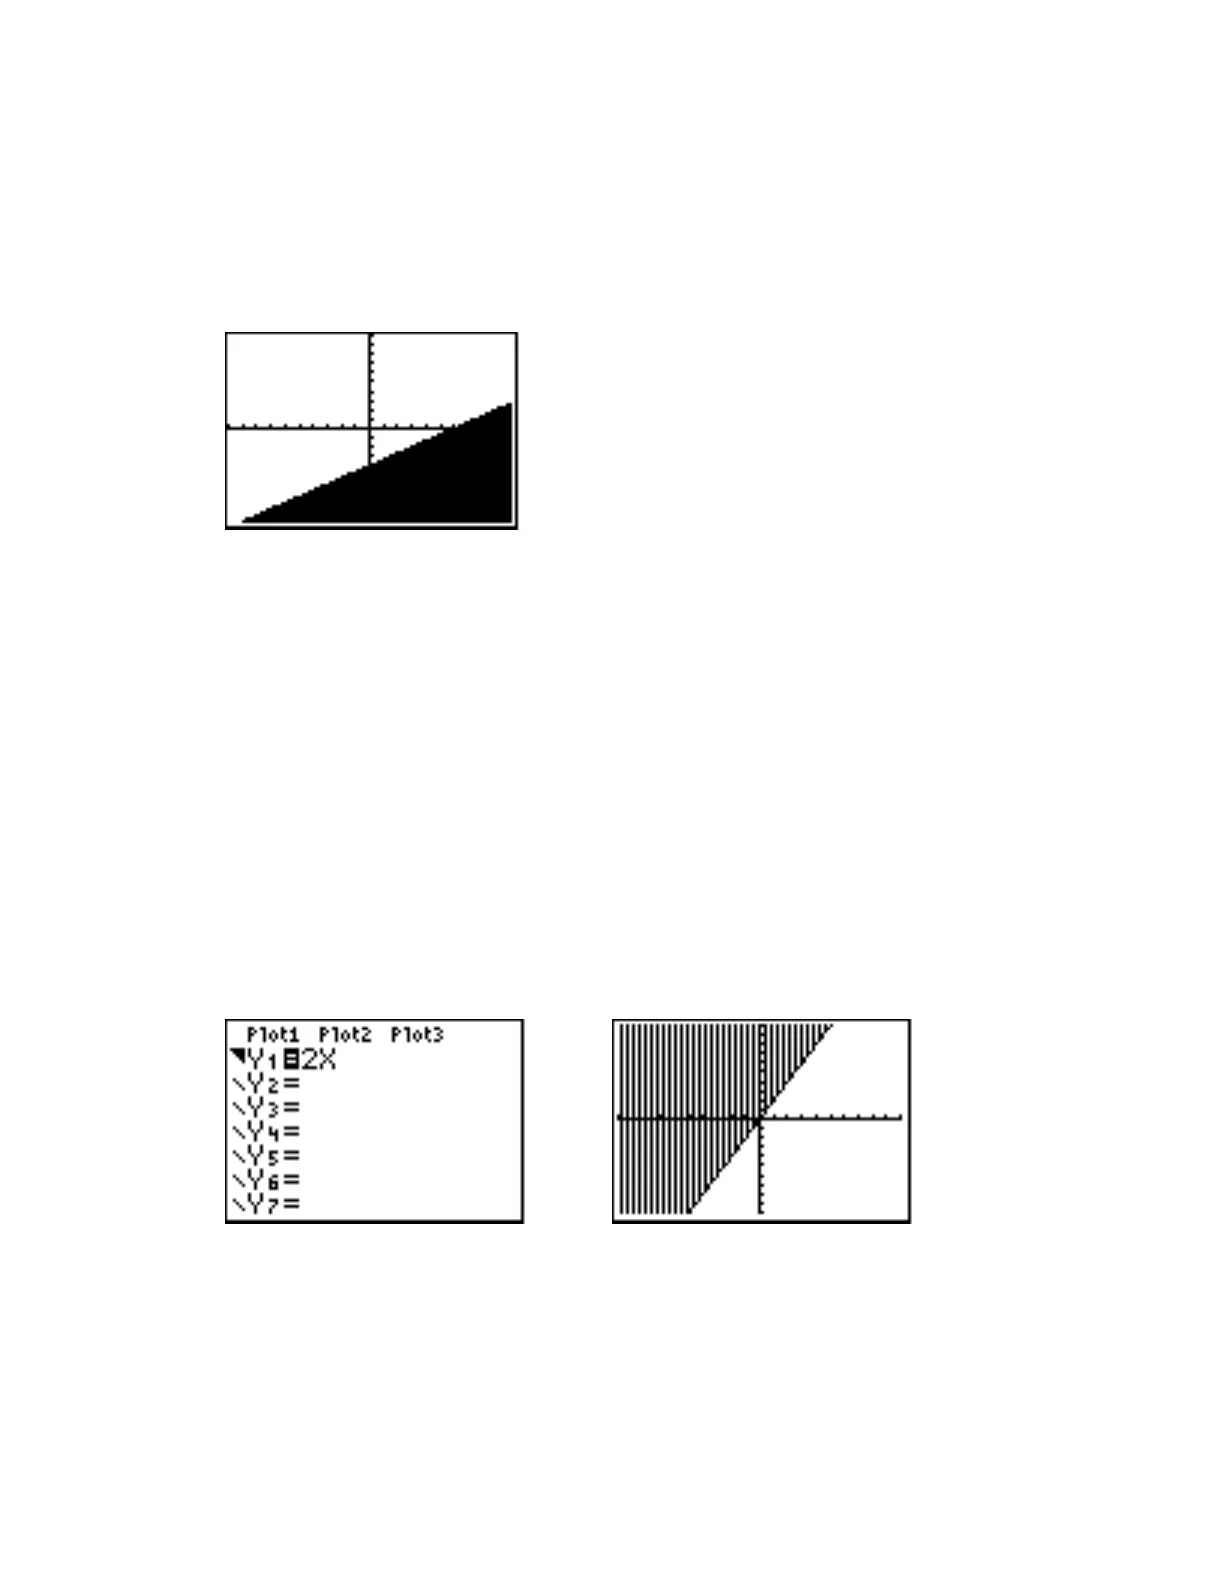
To graph the solutions of the inequality xy 2
, enter in Y1 the equation xy 2
. Graph it in
the Standard viewing window (or any other convenient graphing window). This time, all points
above the line xy 2
are solutions of the inequality. To shade this portion of the graphing
window using the graphing styles feature, go to the Y= screen and use the arrow keys to move the
cursor on the diagonal line which appears to the left of Y1. Press ENTER repeatedly until the style
indicator shows a triangle shaded above and to the right of the diagonal. This indicates that points
above the graph would be shaded in this style. Since in this example we want points above the
graph to be shaded, press GRAPH now to see the shading.
To see how to do the shading with the Shade command, go to the Y= screen, highlight the
styles feature for Y1, and keep pressing ENTER until the standard thin diagonal line reappears.
Then press 2nd [QUIT] to return to the Home screen. In this example, use the Standard viewing
window (ZOOM 6). As was noted earlier, the solution of the inequality consists of all points above
the graph of the equation, since for each x, the values of y must be greater than (above) the values
of y on the graph. Therefore, the graph of the line forms the bottom of the shaded region. There
really is no upper boundary to the shaded region, so any number greater than Ymax will do as the

 Loading...


