To create the list of sequential integers, use
seq(k,k,1,51)→xcoord
Note that the number of elements, 51, is one more than the loglist() argument of 50, since loglist()
returns one more element than the number specified.
Now that we have the three lists, it is a simple matter to use the built-in data plotting functions to create
the plots. Use these keystrokes to set up and display the magnitude plot:
1. Press [Y=] to display the Y= editor
2. Use [UP] and [DOWN] to highlight Plot 1
3. Press [F3] to edit the plot definition.
4. Set the Plot Type to Scatter, set the Mark to Box, set x to xcoord, and set y to mag. Push
[ENTER], [ENTER] to finish editing.
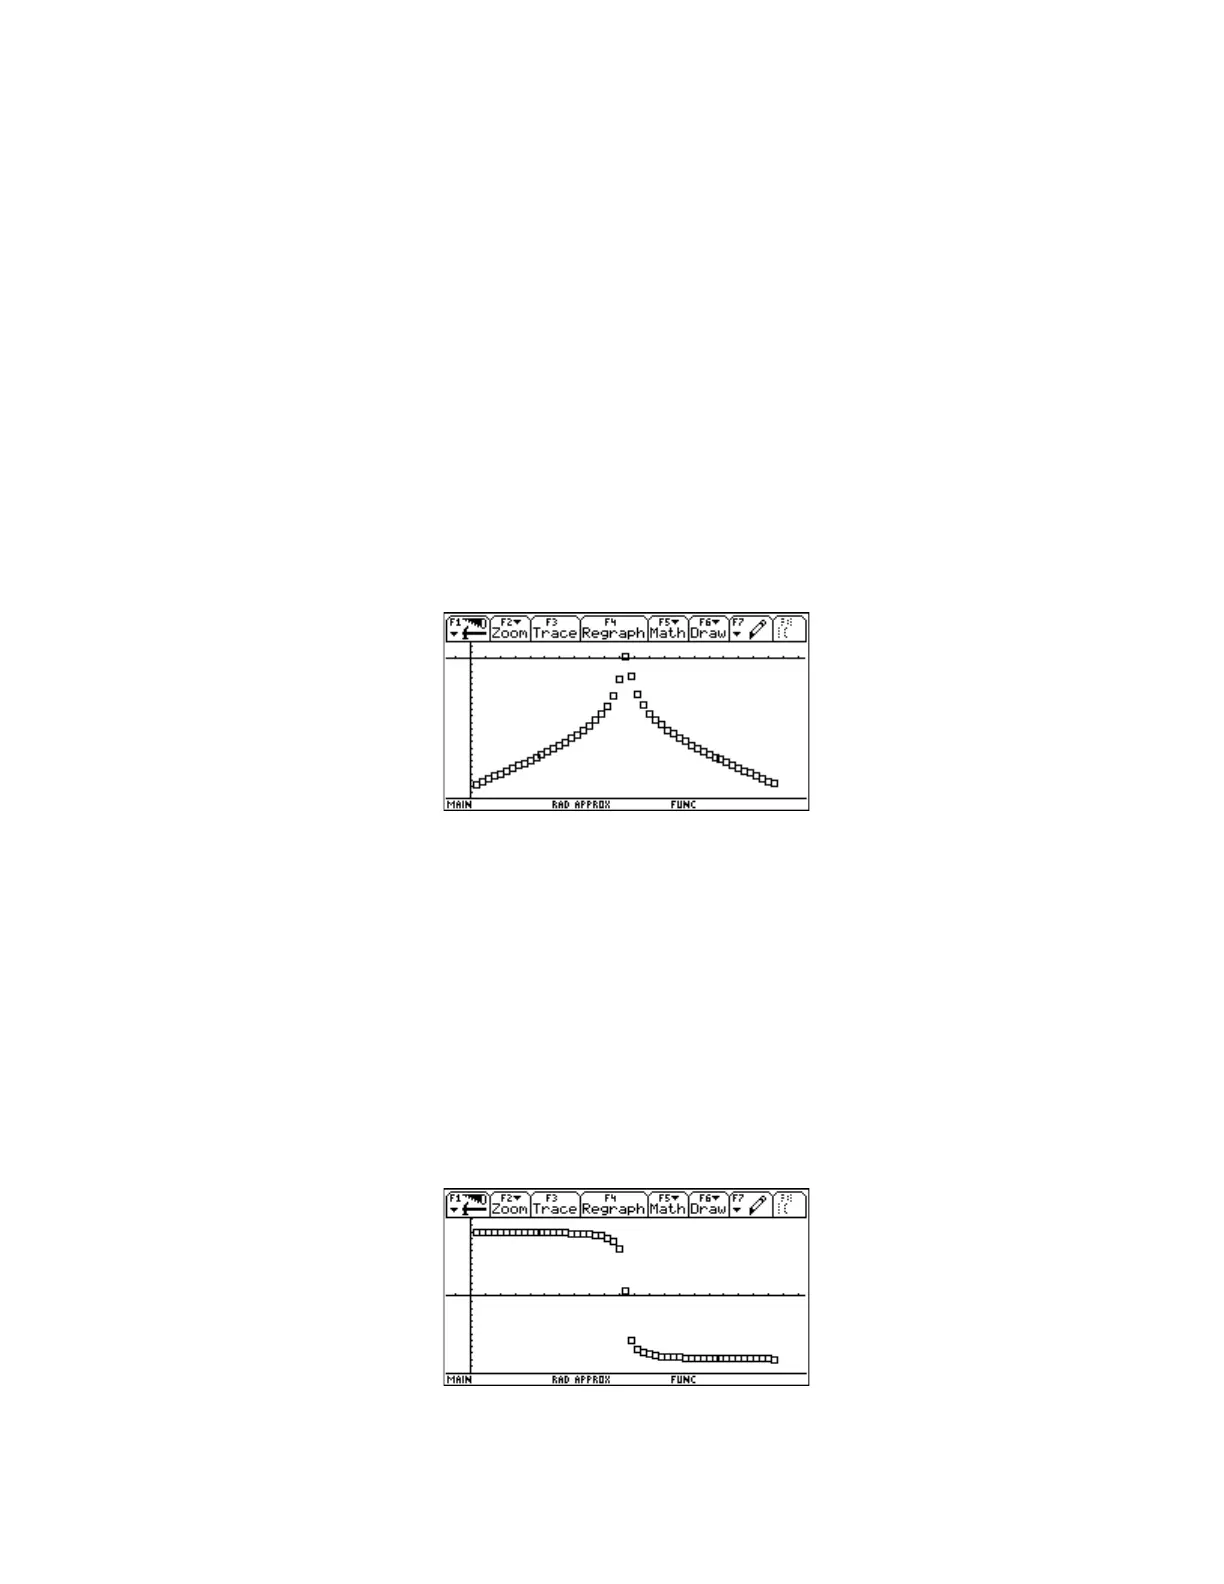
5. Press [F2] to display the Zoom menu, then press [9] to select ZoomData. This is the resulting
magnitude plot on a 92+:
The procedure to display the phase plot is similar:
1. Press [Y=] to display the Y= editor
2. Use [UP] and [DOWN] to highlight Plot 2
3. Press [F3] to edit the plot definition.
4. Set the Plot Type to Scatter, set the Mark to Box, set x to xcoord, and set y to phase. Push
[ENTER], [ENTER] to finish editing.
5. Use [UP] and [DOWN] to highlight the definition for Plot 1, then press [F4] to remove the check
mark.
6. Press [F2] to display the Zoom menu, then press [9] to select ZoomData. This is the resulting
phase plot on a 92+:
4 - 20
 Loading...


