For both the magnitude and phase plots, you can use [F3] to trace the graph and read either the
magnitude or the phase at the bottom of the display, as the yc variable. However, you cannot directly
read the frequency, since the xc variable only shows the elements of the xcoord list. You can, though,
manually display the frequency. Suppose that we want to know the lower frequency at which the
magnitude is about -30dB. Push [F3] to trace the plot, then use [LEFT] and [RIGHT] to move the cursor
until yc is about -30. For this example, yc is -29.67 when xc is 13. Press [HOME] to return to the Home
screen, then enter flist[13] in the entry line. The result is about 188 rad/sec, or 30 Hz.
It is also possible to show the magnitude and phase plots on the same screen, which is useful for
determining the relationship between the two results. Use these steps:
1. Create the magnitude plot as described above.
2. Press [F1] to display the Tools menu, then press [2] to select Save Copy As. In the dialog box,
set the Type to Picture, and set the Variable name to magplot. Press [ENTER], [ENTER] to
close the dialog box.
3. Press [Y=] to display the Y= editor. Select Plot 1 (the magnitude plot) and press [F4] to
remove the check mark.
4. Create the phase plot as Plot 2, as described above. You may want to use a different symbol,
such as the '+' symbol, so that you can easily distinguish the two plots. Display the phase plot
by pressing [F2], then [9] to select ZoomData.
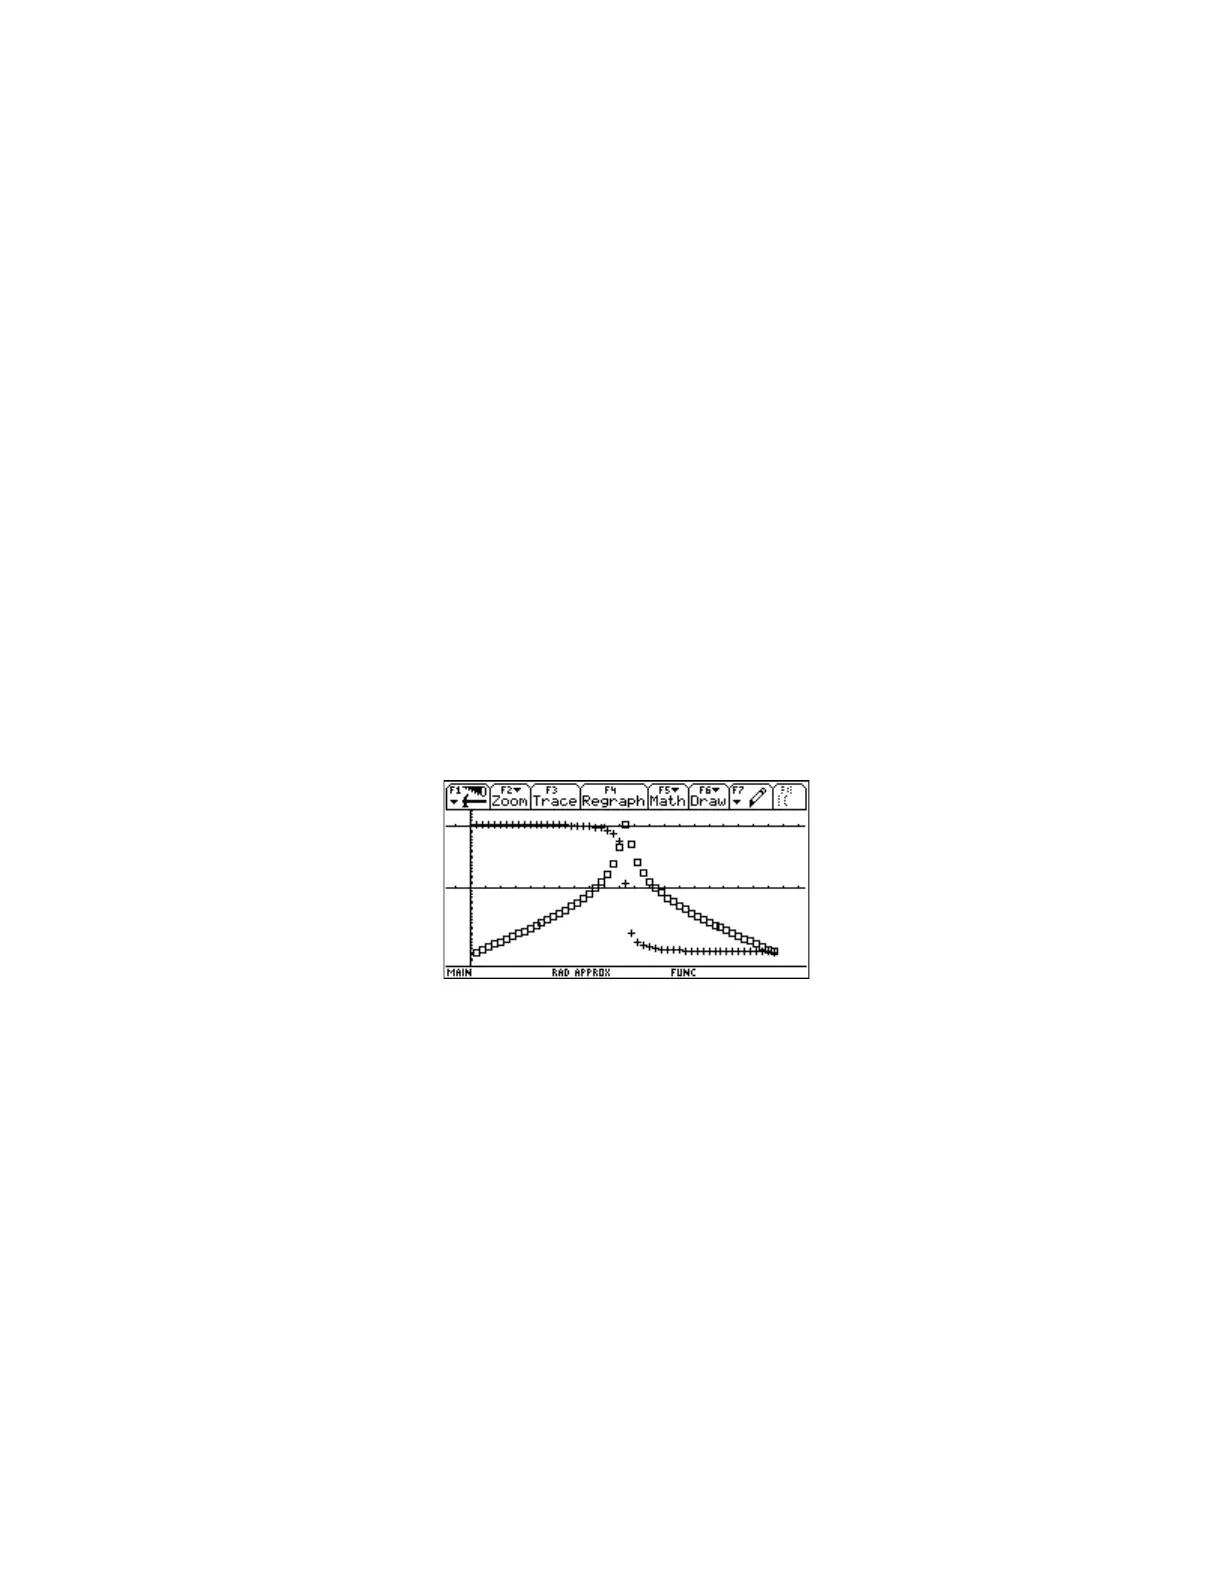
5. With the phase plot still shown, press [F1] to open the Tools menu, then press [1] to select
Open. In the dialog box, set the Type to Picture, and select magplot as the Variable. Push
[ENTER], [ENTER] to close the dialog box. The magnitude plot is shown superimposed on the
phase plot, like this:
Here are some more tips on using this method:
! The number of elements in flist determines the plot resolution. More elements result in a
better-looking plot, but it takes longer to calculate the magnitude and phase. There isn't much point
to using more than 240 elements on a 92+, or 160 elements on the 89, since those are the screen
widths in pixels. If you use a lot of elements, choose Dot or Box for the symbol type. However, for a
quick graph with only a few points, the Box symbol clearly shows each point, even if the points lie
on an axis.
! It is sometimes instructive to plot the phase of the transfer function, as a function of magnitude. This
is easily accomplished once you have created the mag and phase lists. Simple create a data plot
definition with mag as the x-variable, and phase as the y-variable.
Biographical note
The Bode plot is named for Hendrik Bode, an engineer and mathematician working at Bell Laboratories
in the 1920's and 1930's. Along with Harold Black and Harry Nyquist, Bode was instrumental in
4 - 21

 Loading...


