CHAPTER 6. GRAPHING EQUATIONS/FUNCTIONS
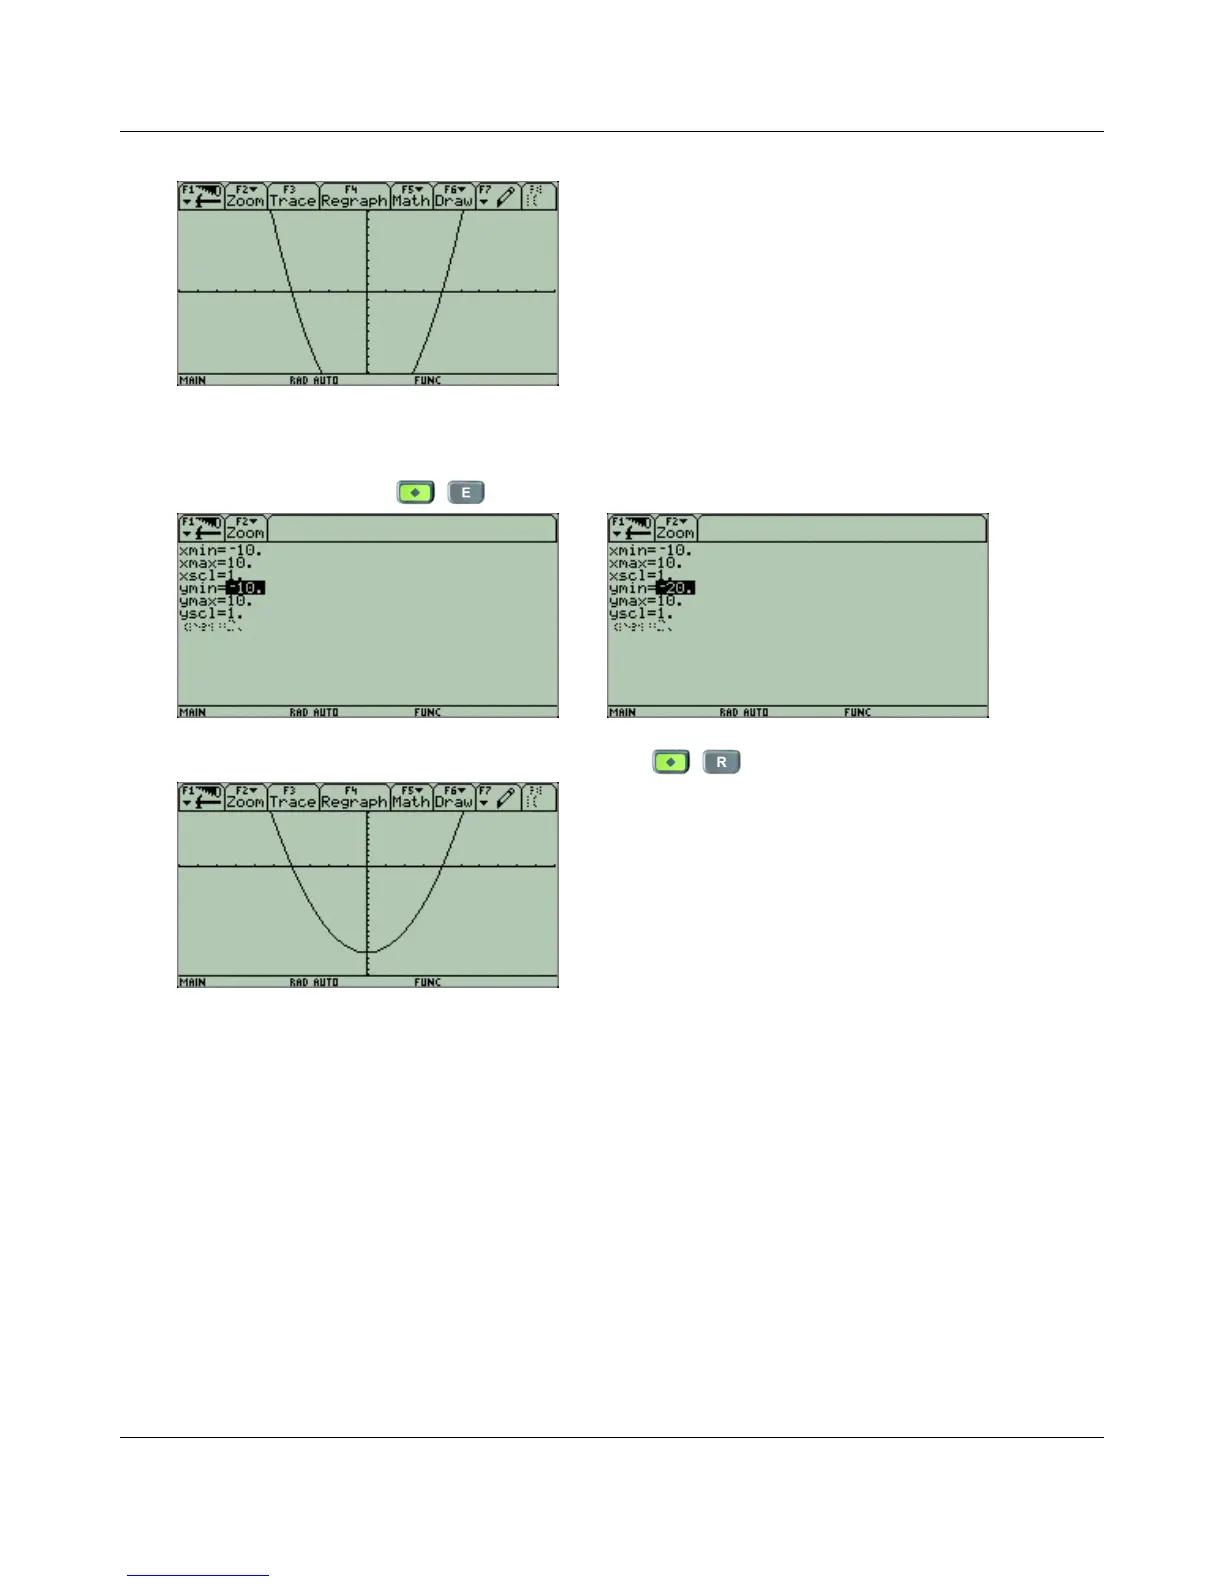
The problem with this window is that you cannot see part of the graph. What you need to do
is to adjust the viewing window to go down further on the vertical axis. Go back to the WIN-
DOW screen by pressing . Scroll down to ymin, and change it to −20.
Graph the function using the new window settings, , and you will see the entire graph.
Notes:
i. With the new dimensions on the vertical axis, the tick marks are very close. You could adjust
this by changing the yscl setting in the WINDOW screen.
ii. These new viewing window settings have been saved and will used the next time you graph
a function, unless you remember to change them.
26

 Loading...


