CHAPTER 6. GRAPHING EQUATIONS/FUNCTIONS
6.2 Checking Window Settings
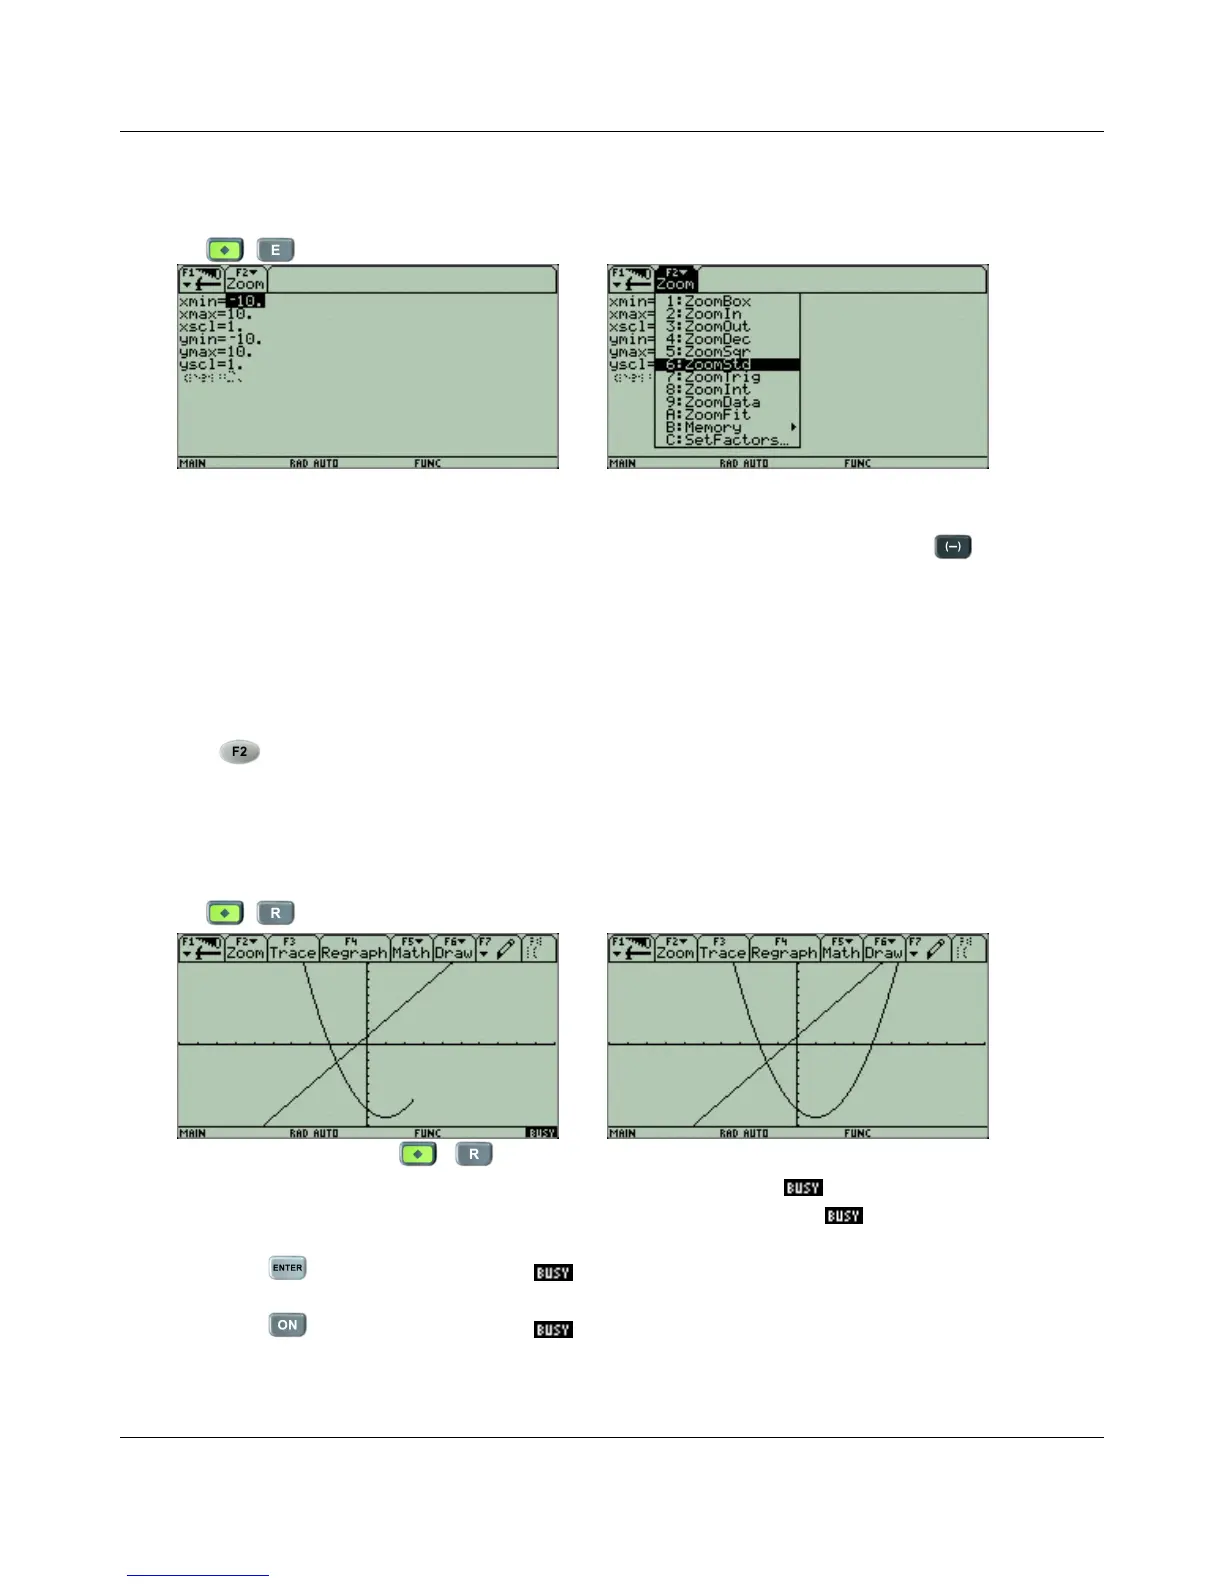
Press to enter the WINDOW screen.
The standard viewing window is [−10, 10] for both the x and y axes. If the viewing window is
different, you can manually reset it to the standard viewing window but scrolling up and down
with the arrow keys and entering −10 or 10 as appropriate. Make sure you use to enter in
negative values.
The xscl and yscl settings are used to set the scale, or tick marks, on the respective axes. For
the standard viewing window, both values are 1.
Another option to reset the window values to the standard viewing window is to use the Zoom
menu, . If you use the sixth option 6: ZoomSTD, the calculator will automatically reset all
the window settings to the standard viewing window and also start graphing the function(s).
6.3 Graphing the Equation
Press to enter the GRAPH screen and graph the functions.
As soon as you pressed , the calculator will start to graph the equations. Look in
the bottom right corner of the left screen shot and you should see . While the calculator is in
the process of graphing, it will show that is it busy. Once it is done, the message will go away.
If you press while the calculator is , it will pause the graphing.
If you press while the calculator is , it will cancel the graphing.
24

 Loading...


