Calibration & Measurement Module for OTKB/OTKBFM Chapter 5: Operation
TTN030035-D02 Page 10
Chapter 5 Operation
Before quantitative measurements can be performed with the optical tweezers system, it is necessary to
determine the factor to convert detector voltages to distances and to find the trap stiffness. Changing the trapping
laser power during this procedure will affect the calibration parameters. Therefore it often makes sense to run the
calibration sequence described below for various laser power settings. Further on, the distance of the laser trap to
the cover slip will affect the trap stiffness significantly. Again you can determine the calibration for different z-
positions using the positioning system of the stage. During an initial calibration make sure that your trap is located
several microns above the cover glass. This can be achieved by moving a trapped bead towards the cover glass
until it contacts the glass and goes out of focus. The z-axis adjustment knob on the stage has micrometer
markings, which you can then use to move the trap away from the cover glass surface. If the bead is too close to
the wall, hydrodynamics effects or physical constraints with the coverslip will restrict the Brownian motion, while at
heights above 5 µm the optical trap loses its tight focus.
We assume that you have setup your tweezers system and aligned the detector to monitor the back focal plane of
the condenser. Further on you need to load a sample with a combination of stuck and freely diffusing
microspheres. See Section 5.3 for details.
5.1. Position Calibration
When a bead is located close to the trap center a linear relationship exists between the quadrant detector voltage
and the distance of the bead to the trap center. To find the corresponding conversion factor we use a stuck bead
and move it across the trap at a constant speed. Plotting the detector voltage versus stage position a curve can
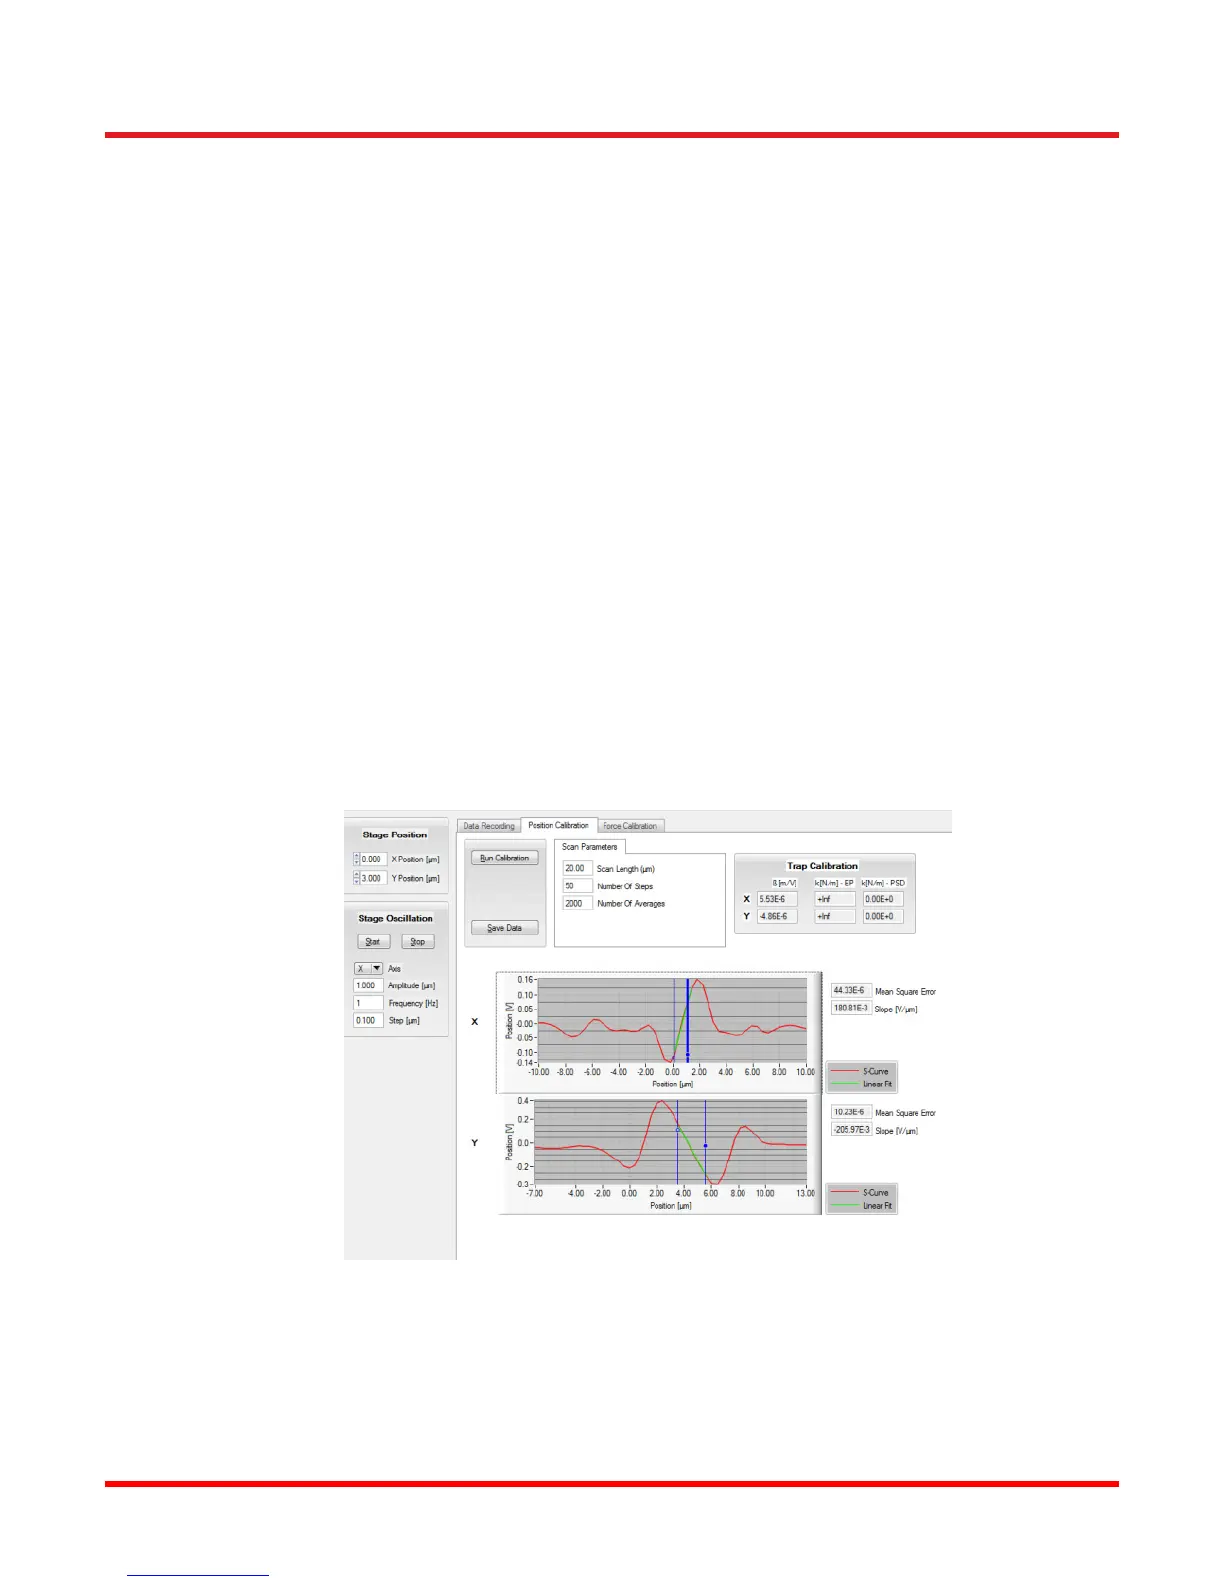
be fitted to the linear range, providing the conversion factor. A sample plot is shown in Figure 7 below.
1. Move the sample stage until you see a free bead on your camera image. Enable the trapping laser and
trap the bead. Mark the position on your monitor, e.g. using a small piece of tape. Disable the laser to
release the bead.
Figure 7 Example Position Calibration Plot Showing Fit to the Linear Range
2. Find a stuck bead and move it to the position marked as the trap position on the screen.
3. Select the “Data Recording” Tab and click on “Start Tracking”. You will see a curve similar to the example
shown in Figure 8 on Page 13.
 Loading...