58
FUNCTION CHARACTERISTICS
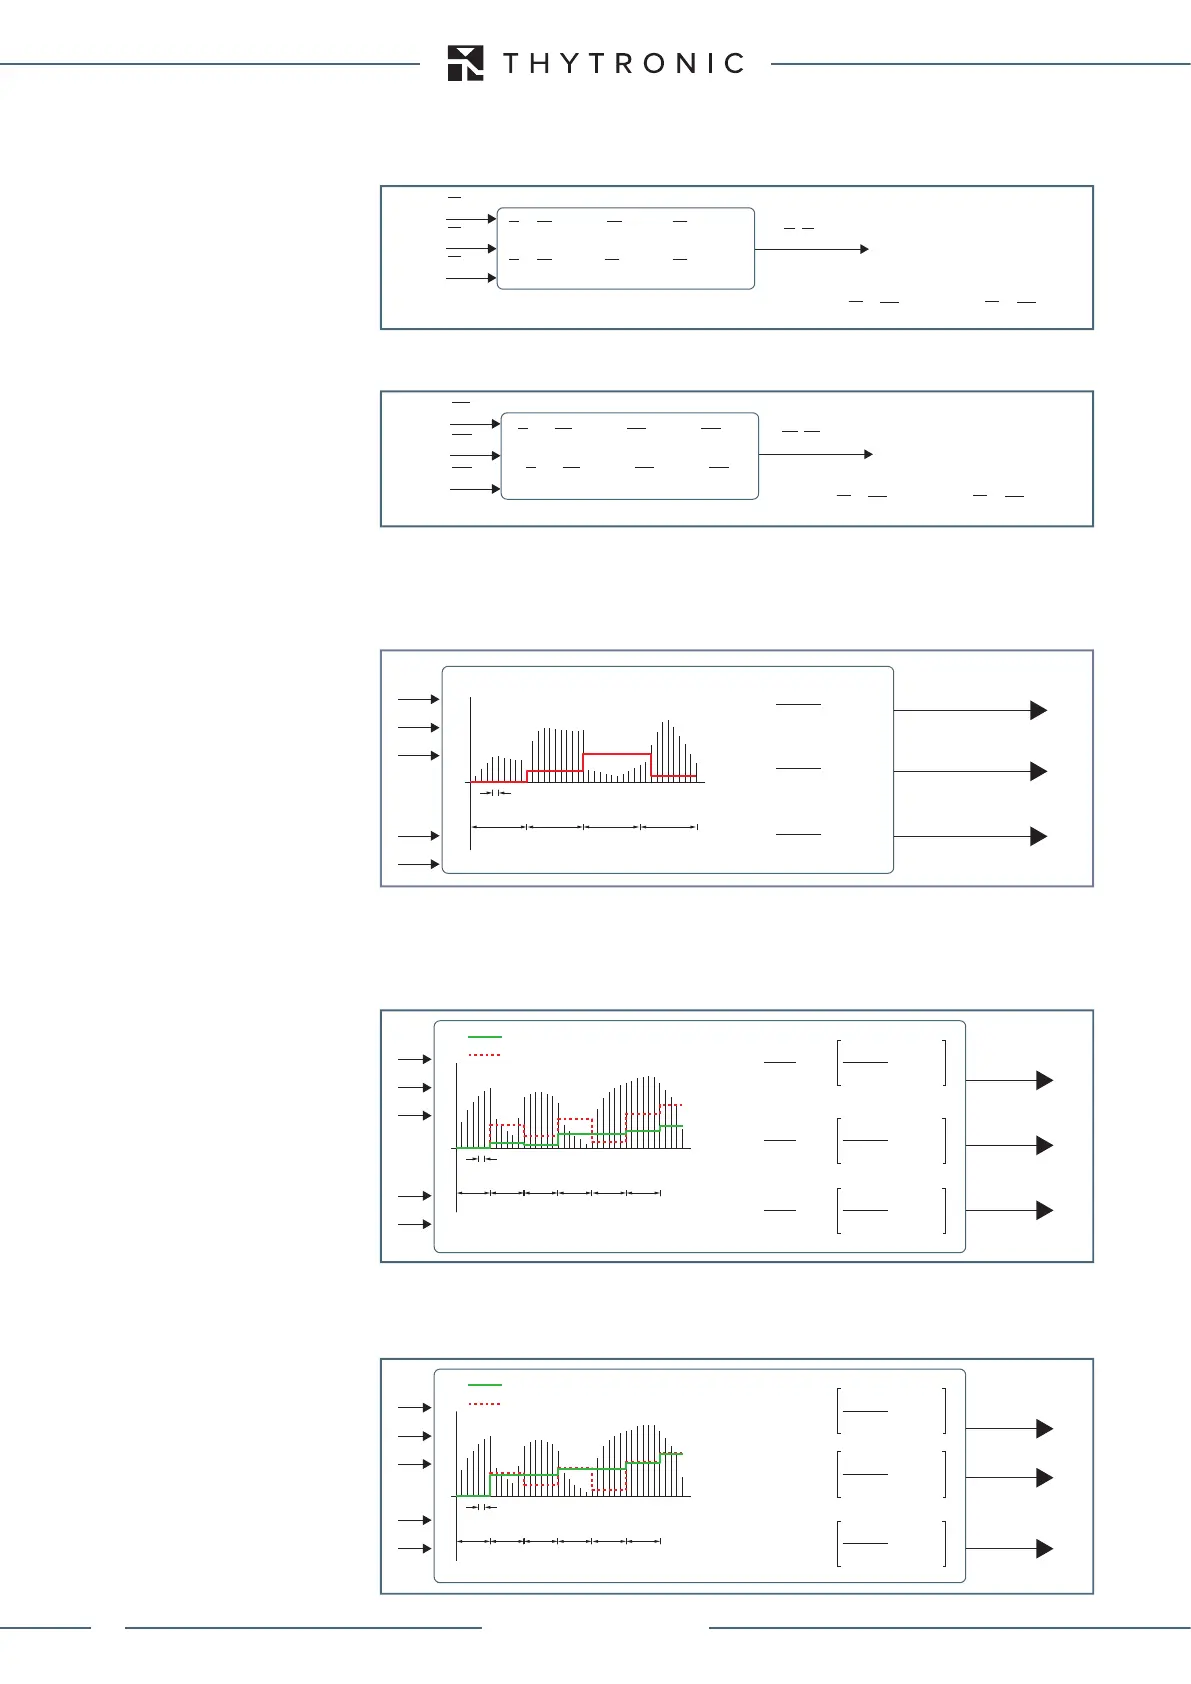
Sequence
• Fundamental RMS positive sequence current: I
1
• Fundamental RMS negative sequence current: I
2
• Fundamental RMS positive sequence voltage: U
1
• Fundamental RMS negative sequence voltage: U
2
Demand
• Fixed demand (I
L1FIX
, I
L2FIX
, I
L3FIX
, ±P
FIX
, ±Q
FIX
)
Inside an adjustable time interval t
FIX
, an average magnitude is calculated for phase currents I
L1
,
I
L2
, I
L3
, active power ±P
and reactive power ±Q
of measures taken every second. The average va-
lues are stored at the end of the same time interval.
• Rolling demand (I
L1ROL
, I
L2ROL
, I
L3ROL
, ±P
ROL
, ±Q
ROL
)
Inside an adjustable time interval N
ROL
∙t
ROL
, an average magnitude is calculated for phase curren-
ts I
L1
, I
L2
, I
L3
, active power ±P
and reactive power ±Q
of measures taken every second, where t
ROL
is
the length of any time subinterval and N
ROL
is the number of the time intervals. The average values
are stored at the end of the same time subinterval.
• Peak (I
L1MAX
, I
L2MAX
, I
L3MAX
, ±P
MAX
, ±Q
MAX
)
Inside an adjustable time interval t
ROL
, the maximum magnitude is calculated for phase currents
I
L1
, I
L2
, I
L3
, active power ±P
and reactive power ±Q
of measures taken every second. The average
values are stored at the end of the same time interval t
ROL
(Rolling demand common parameter).
I1-I2.ai
I
L1
I
1
, I
2
I
2
= (I
L1
+ e
-j120°
I
L2
+ e
+j120°
I
L3
) / 3
I
1
= (I
L1
+ e
+j120°
I
L2
+ e
-j120°
I
L3
) / 3
I
L3
I
L2
(I
n
)
e
-j120°
= -
√3
j
1
2 2
-
e
+j120°
= -
√3
j
1
2 2
+
U2.ai
U
L1
U
1
, U
2
U
2
= (U
L1
+ e
-j120°
U
L2
+ e
+j120°
U
L3
) / 3
U
1
= (U
L1
+ e
+j120°
U
L2
+ e
-j120°
U
L3
) / 3
U
L3
U
L2
e
-j120°
= -
√3
j
1
2 2
-
e
+j120°
= -
√3
j
1
2 2
+
(u
n
)
Fix-Demand.ai
1s
I
L1FIX
, I
L2FIX
,I
L3FIX
±P
FIX
t
FIX
±P
±Q
(I
n
)
(P
n
)
(Q
n
)
±Q
FIX
I
L2
I
L1
I
L3
I
LxFIX
I
Lxn
t
F I X
∙ 60
t
F I X
∙ 60
n=1
∑
1
±Q
FIX
= ±Q
n
t
F I X
∙ 60
t
F I X
∙ 60
n=1
∑
1
±P
FIX
= ±P
n
t
F I X
∙ 60
t
F I X
∙ 60
n=1
∑
1
t
FIX
t
FIX
t
FIX
Rol-Demand.ai
Rolling demand example with N
ROL
=4
I
L1ROL
I
L 2ROL
I
L 3ROL
±P
ROL
±P
±Q
(I
n
)
(P
n
)
(Q
n
)
±Q
ROL
I
L2
I
L1
I
L3
0
1 2 3 4 5
1s
t
ROL
t
ROL
N
ROL
t
ROL
t
ROL
t
ROL
6
t
ROL
Average inside subinterval t
ROL
I
L xROL
= I
Lxk
t
ROL
∙60
t
ROL
∙60
k=1
∑
N
ROL
n=1 n
∑
1
N
ROL
1
±P
ROL
= ±P
k
t
ROL
∙60
t
ROL
∙60
k=1
∑
N
ROL
n=1 n
∑
1
N
ROL
1
±Q
ROL
= ±Q
k
t
ROL
∙60
t
ROL
∙60
k=1
∑
N
ROL
n=1 n
∑
1
N
ROL
1
Max-Demand.ai
Maximum value of averages inside time interval t
ROL
Average inside time interval
t
ROL
I
L1MAX
I
L2MAX
I
L3MAX
±P
MAX
±P
±Q
(I
n
)
(P
n
)
(Q
n
)
±Q
MAX
I
L2
I
L1
I
L3
1s
t
ROL
t
ROL
t
ROL
t
ROL
t
ROL
t
ROL
MAX
I
LxMAX
= I
Lxn
t
ROL
∙60
t
ROL
∙60
n=1
∑
1
MAX
±P
MAX
= ±P
n
t
ROL
∙60
t
ROL
∙60
n=1
∑
1
MAX
±Q
MAX
= ±Q
n
t
ROL
∙60
t
ROL
∙60
n=1
∑
1
XMR-D EQUIPMENT MANUAL
Ed. 2.9 - 02/2021


 To Next Page