INTRODUCTION
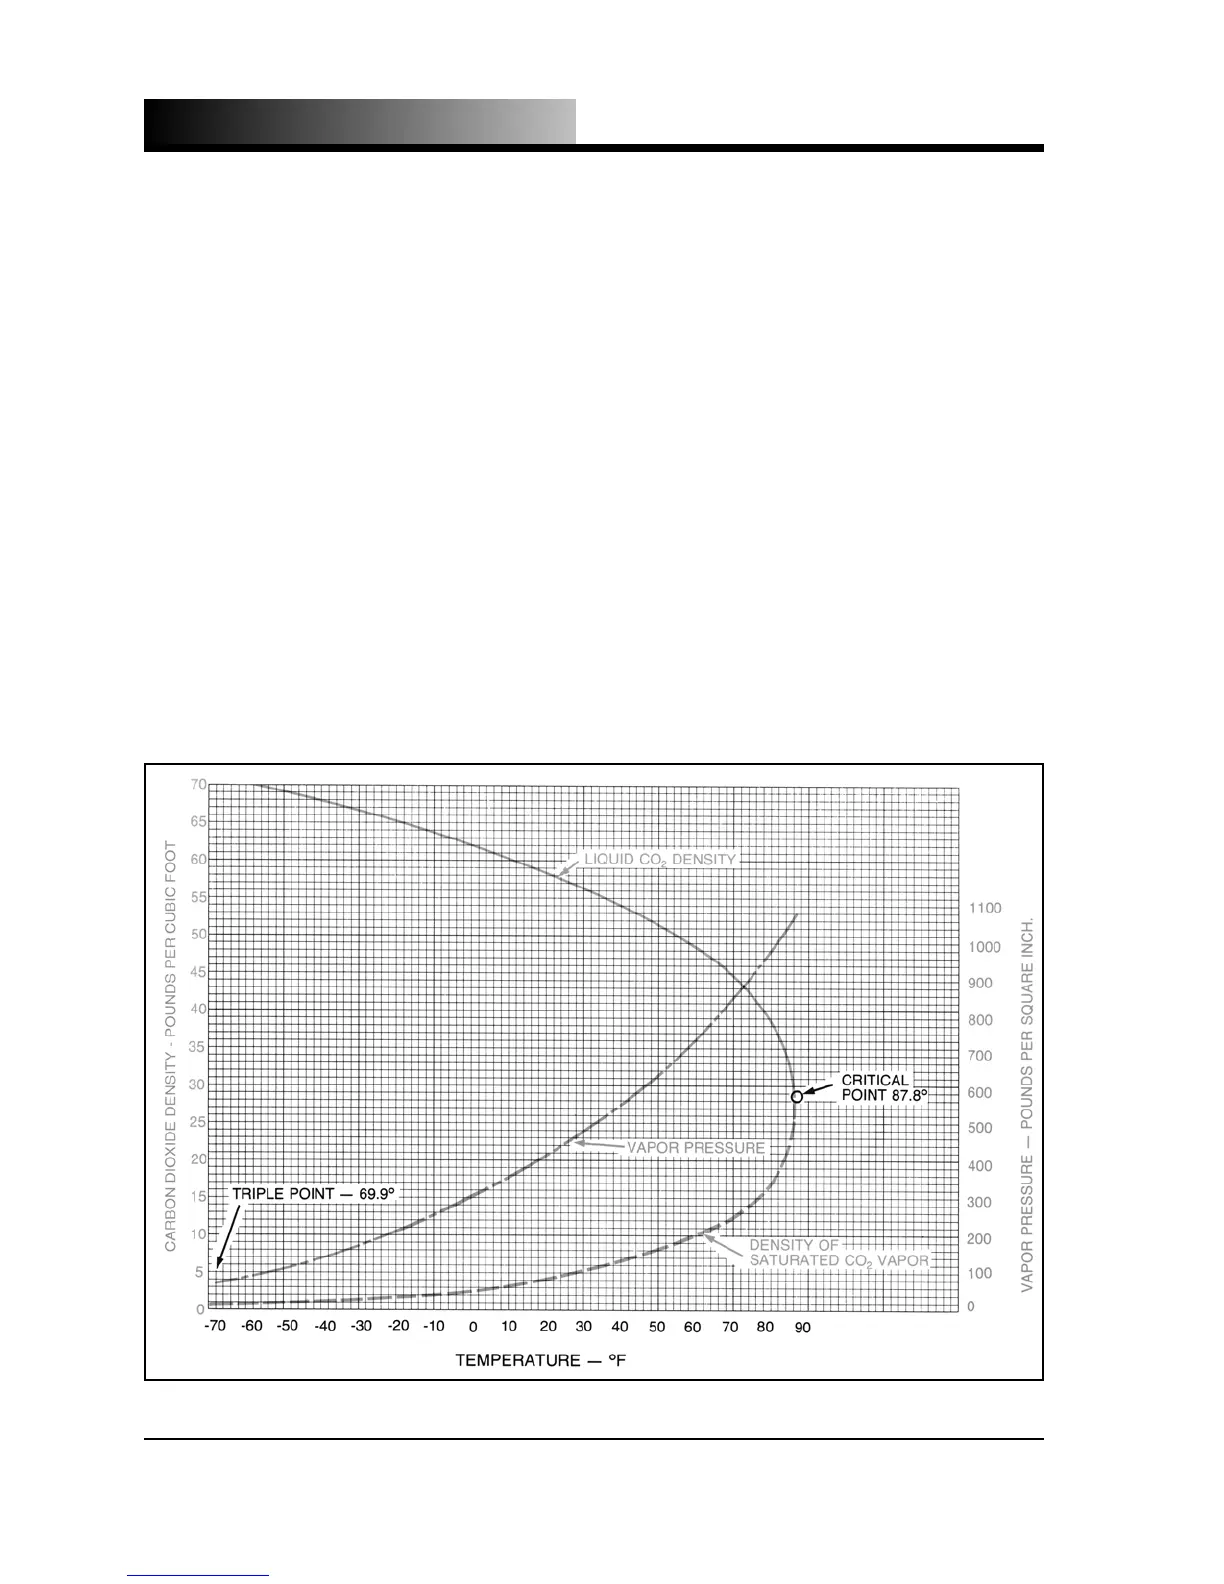
following the liquid density curve, one finds that the liquid becomes less dense as the
temperature increases and at 70
o
F (21.1
o
C), the liquid density is around 47 pounds
per cubic foot (754 kg/m
3
).
By comparing the pressure and liquid density at 70
o
F (21.1
o
C) [837.8 psig (57.8
bar) and 47.6 pounds per cubic foot (764 kg/m
3
)] with the pressure and density at
0
o
F (-17.8
o
C) [291.1 psig (20.1 bar) and 63.65 pounds per cubic foot (1022 kg/m
3
)],
it is obvious that relatively large quantities of carbon dioxide liquid can be stored in
relatively small, thin walled pressure vessels; hence low-pressure bulk storage of
CO
2
.
The term "low-pressure" is used in the industry to describe the storage of carbon
dioxide at low temperatures below ambient, usually around 0
o
F (-17.8
o
C). It is a
relative term and should not be taken literally, as the pressures involved range up to
approximately 350 psig (24.1 bar).
1.3
Fig. 1.1 - Carbon Dioxide Density & Vapor Pressure Curves