Installation Guide
20 18-HD73D1-9E-EN
8.2 Save Logs
The 850 Control has the ability to log data on USB Flash
Drive. Attach a USB Flash Drive to the included USB
connector, plug it into the 850 Control and select Save
Logs from the Service Menu.
The amount of data logged will be dependent on the
number of days logged and the storage capability of the
USB Flash Drive. Access Save Logs by navigating to
Service Menu>Save Logs.
8.3 Diagnostics
8.3.1 Alerts
Within the Diagnostic screen are two items related to alerts:
• Current Alerts – Alerts which are currently active
• Alert History – Cleared Alerts (last 30 days)
NOTE: Each alert will have a date/timestamp of when the
alert was negated. The Date/Time stamp for Current Alerts
is when the alert was asserted. For Alert History the date/
timestamp is when the alert was negated.
From both screens the user can select an alert code and
get additional information on the alert as well as a list of
possible causes, similar to the Interactive Troubleshooting
Guide located on ComfortSite/ASDealernet
All alerts are categorized by severity:
• CRITICAL
— Loss of heating/cooling operation
— Service call is required
— Alert messages are displayed on the home screen
and when closed, a flashing red icon is used to
indicate alert condition.
• MAJOR
— Reduced functionality - minimum operation is possible
— Service call is not immediately required
— Alert messages are not displayed on the home screen
but a yellow icon is used to indicate alert condition.
NOTE: Critical and Major alerts can be displayed on the
home screen by pressing the alert icon on the shortcut tool
bar (top right of home screen).
• MINOR
— Functionality may be lost but should recover or the
information is for diagnostic purposes / performance
monitoring
— Service call is not required
— Minor alerts are only displayed in the Diagnostic
screen
Diagnostics can be accessed by navigating to
Service Menu>Diagnostics.
8.3.2 Summary Table
The 850 Control has a Summary Table which lists all the
communicating devices that have been discovered. The
screen is made up of four fields:
• Select: Allows user to remove devices that have
a Status of “Offline” from persistent storage.
Online devices cannot be removed without being
disconnected from the communicating bus.
• Device Information: Lists the device name and model/
serial number
• Enabled: Identifies whether the device has been
enabled
• Status: Identifies whether the device is currently
reporting on the bus (Only “Offline” devices can be
removed)
The Enabled and Status field can be used to troubleshooting/
informational purposes:
• Enabled + Online: Device has been enabled and is
currently reporting on bus
• Enable + Offline: Device has been enabled but is not
reporting (Err.126.00 will typically be triggered during
this condition).
• Disabled + Online: Device has not been enabled but
is reporting (verify device has been configured in the
installer settings).
• Disabled + Offline: Device has not been enabled and
is currently not reporting.
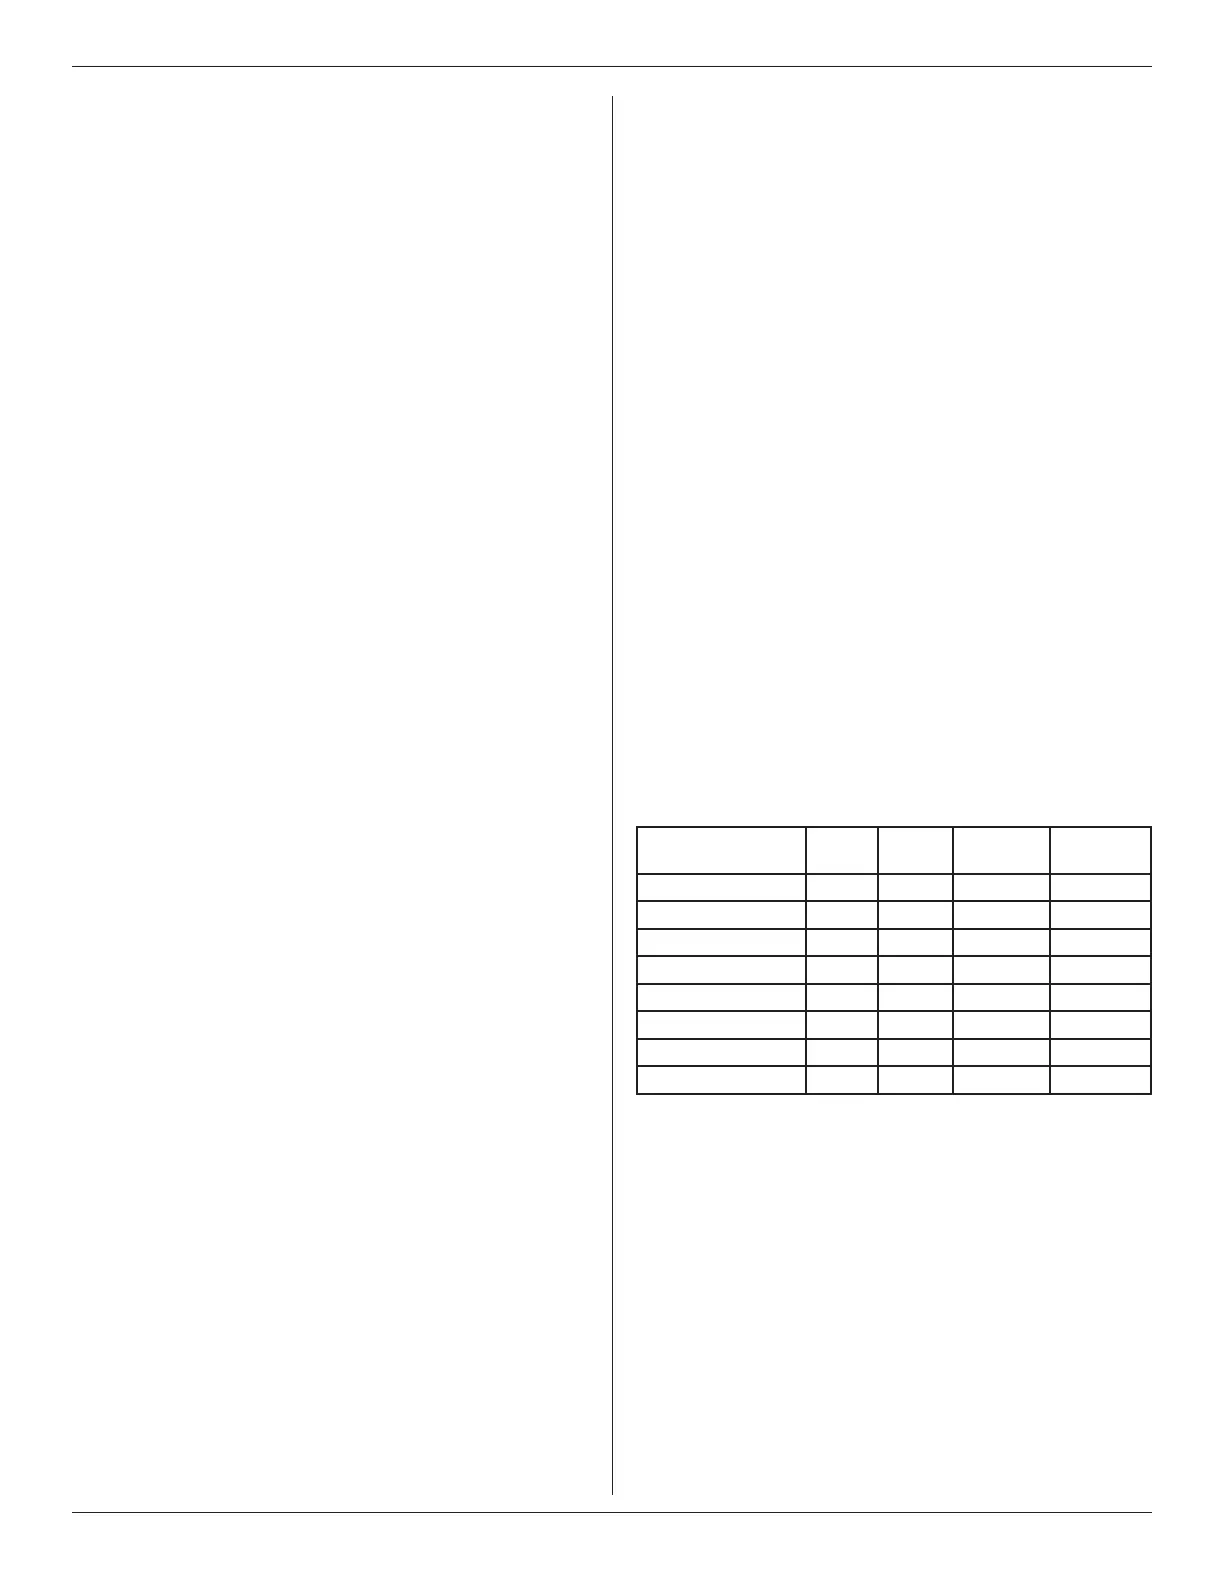
8.4 History
History is accessed by navigating to Service Menu>History
The History screen allows the technician to view cycle count
and run time data for each mode and stage of operation.
This data provides a snap-shot into system operations.
TODAY LAST 7
DAYS
CURRENT
MONTH
LAST
MONTH
Y1 COOLING 0
1
/0
2
0
1
/0
2
0
1
/0
2
0
1
/0
2
Y2 COOLING
Y1 HEATING
Y2 HEATING
W1
W2
W3
DEFROST CYCLES
1
Indicates cycle count
2
Indicates cycle time in minutes
8.5 System Report
The System Report Screen provides technicians with
important system operational data in one, concise screen.
The data is provided in real-time and updates as the data
changes.
8.5.1 Non-Variable Speed Screens
— System Status - mode and stage of operation
— Load Value
— Fan Status
— Indoor Temperature
— Indoor Relative Humidity
— Heating and Cooling Setpoints