Graphs
26 RT-SVX49C-EN
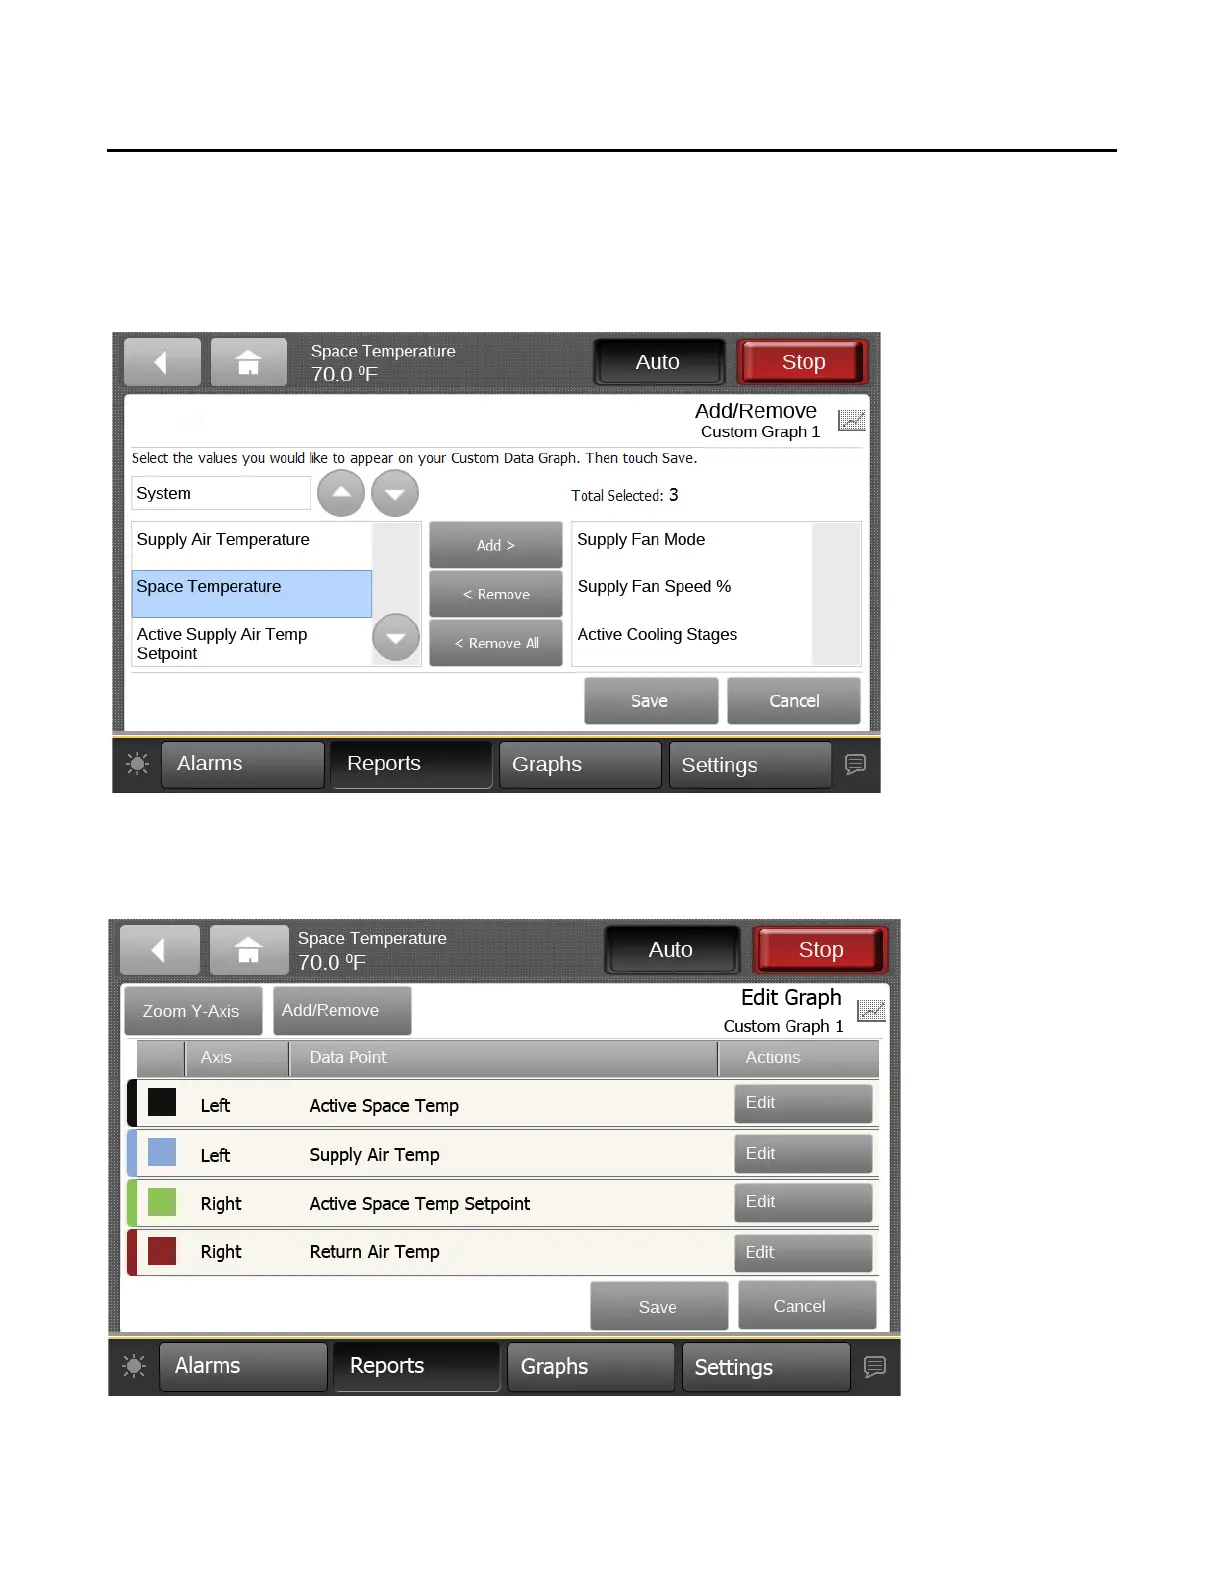
3. Touch the Add/Remove button to add values to the
custom data graph.
The Add/Remove screen appears.
4. Use the arrow buttons to select a value.
5. Select the values, then touch the Add button (up to four
sel
ections are allowed).
6. Touch the Save b
utton.
The Edit Graph screen appears,
which reflects the selected values.
Figure 15. Adding data logs to the custom graph
7. Use the Edit Graph screen to modify the graph. Touch
the Edit button that corresponds with the value that
you want to change. Only one value can be edited at a
time.
Figure 16. Edit graph screen (after values have been added)
8. From the Edit screen you can choose which Y-axis to
display the value, a color, and whether or not to show
data samples. Touch the Save button when finished.
Repeat the process with remaining values.

 Loading...