EasyManua.ls Logo

Trane AdaptiView - User Manual

Trane AdaptiView
72 pages
Print Icon
To Next Page IconTo Next Page
Loading...
Operations Guide
Tracer AdaptiView
Display
for Gear-Driven Water-Cooled CenTraVac
(CVGF) Chillers
X39641144-010
March 2009
CTV-SVU02A-EN

Table of Contents

Questions and Answers

  • R
    Randall ChristianJul 31, 2025
    What to do if Trane AdaptiView Monitor displays 'Display Failed to Establish Communication'?
    • D
      David GarrettJul 31, 2025
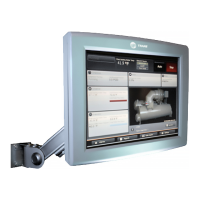
      If the Trane Monitor displays the error message 'Display Failed to Establish Communication,' it indicates that communication has not been established. Check the power and communication cable connections. It's also possible the UC800 has an invalid configuration, in which case you should download a valid configuration using the Tracer TU service tool.
  • B
    batesaaronAug 5, 2025
    What to do if Trane Monitor displays 'Communication lost with UC800'?
    • D
      dharrisonAug 5, 2025
      If the Trane Monitor displays the error message 'Communication lost with UC800', it means that communication was established and then lost, or the UC800 configuration is invalid. Follow the instructions provided in the error message, check power and communication cables and update the UC800 software with the Tracer TU technician utility.
  • C
    Charles Coleman MDAug 12, 2025
    What to do if Trane Monitor displays 'Missing file name' error?
    • J
      jacklewisAug 12, 2025
      If the Trane Monitor displays the error message '[*Missing file name],' it indicates that a file is missing, or the Tracer TU service tool is connected and the LLID binding screen is displayed, or the UC800 has an invalid configuration. To resolve this, cycle power to the display and the UC800. If the Tracer TU service tool is connected, disconnect the USB cable and wait approximately 10 seconds before reconnecting it. If the UC800 has an invalid configuration, download a valid configuration using the Tracer TU service tool.
  • M
    Michael GutierrezAug 18, 2025
    What does it mean if the Trane AdaptiView Monitor says 'The display is about to restart'?
    • A
      Alex WilsonAug 18, 2025
      The Trane Monitor displays the message 'The display is about to restart' if all of the following conditions occur: it is 2:00 AM, there has been no touchscreen activity for 30 minutes, and a designated amount of continuous operation has occurred. Follow the instructions in the error message.
  • S
    Sarah CruzAug 23, 2025
    How to fix a Trane AdaptiView Monitor screen that only partially displays?
    • M
      Michael OrrAug 23, 2025
      If the Trane Monitor screen only partially displays (the Auto and Stop buttons appear, but there is no text), it indicates that the UC800 configuration is invalid. To fix this, download a valid configuration using the Tracer TU service tool.

Summary

Introduction

Equipment Description

Basic features of the Tracer AdaptiView display, including hardware and screen characteristics.

Touchscreen Guidelines

Best practices for interacting with the touch screen for optimal performance and longevity.

Reference Sources

Lists related documents for additional information on CenTraVac chillers with AdaptiView control.

Screen Overview

Chiller Status Area

Describes the persistent area displaying essential chiller status and control information.

Main Display Area;Home Screen

Details the primary screen for viewing chiller status information and component data.

Main Display Area;Screen Saver

Covers the screen dimming and screen saver function after a period of inactivity.

Component Screens

Describes screens providing detailed data for individual chiller components.

Main Menu Area

Explains the persistent menu at the bottom for navigating to major sections of the display.

Stopping;Restarting Chiller Operation

Stopping the Chiller

Provides instructions for safely stopping the chiller through normal or emergency procedures.

Restarting the Chiller

Outlines the procedure for initiating the chiller restart process from the display.

Alarms

Viewing the Alarms Screen

Details how to access and view the screen displaying active and historic chiller alarms.

Understanding Alarm Icons

Explains the meaning of different icons used to represent alarm severity and type.

Viewing Active and Historic Alarms

Describes how to view alarms categorized as active, historic, or all alarms.

Sorting Alarms

Explains how to sort the alarms list by different criteria like date, severity, or status.

Resetting Alarms

Details the process for resetting alarms, distinguishing between latching and non-latching types.

Other Alarm Indicators

Covers alternative indicators for alarm conditions visible from any screen.

Reports

Viewing the Reports Screen

Guides users on accessing the screen to view various reports, including custom ones.

Viewing the Log Sheet

Explains how to access the Log Sheet report containing recommended data.

Viewing the ASHRAE Chiller Log

Details accessing the ASHRAE Chiller Log report.

Creating and Viewing a Custom Report

Instructions on creating and viewing personalized reports with specific data points.

Editing a Custom Report

Procedures for modifying existing custom reports by adding, removing, or reordering data.

Viewing Unit Information (About This Chiller)

How to access detailed unit information such as model, serial number, and software build.

Data Graphs

Viewing the Data Graphs Screen

Accessing the screen to view default and custom data graphs.

Viewing Data Graphs

How to display and interpret live data graphs, including X and Y axes.

Changing the Scales on Data Graphs

Instructions for adjusting the X and Y-axis scales for better data visualization.

Creating Custom Data Graphs

Steps to create new data graphs, either from default templates or from scratch.

Editing Custom Data Graphs

How to modify existing custom data graphs, including line style, axis location, and color.

Deleting a Custom Data Graph

Procedure for removing custom data graphs from the system.

Equipment Settings

Viewing the Settings Screen

Accessing the main settings screen that categorizes various equipment adjustments.

Viewing and Changing Equipment Settings

General procedure for navigating to and modifying specific equipment settings.

Chiller Settings

Details on available settings related to chiller operation and configuration.

Setpoint Sources

Information on how setpoints are managed and prioritized from different sources.

Feature Settings

External Chilled Water Setpoint

Setting to enable or disable external control of the chilled water setpoint.

Ice Building

Configuration option for managing the ice building process.

Security

Enabling or disabling the security feature for user access control.

Chilled Water Reset

Settings related to the chilled water reset functionality.

Manual Control Settings

Options for manually controlling various chiller functions and components.

Display Settings

Viewing the Settings Screen

Accessing the screen to adjust display preferences, language, and date/time.

Viewing and Changing Display Preferences

Customizing the display format, units, brightness, and timeout settings.

Viewing and Changing the Language Preference

How to select the preferred language for the display interface.

Viewing and Changing Date and Time Preferences

Setting the correct date and time for the display.

Cleaning the Display

Procedure to temporarily disable touch input for safe screen cleaning.

Security Settings

Viewing the Settings Screen

Accessing the security section to manage user login and security levels.

Disabling;Enabling Security

Steps to turn the security feature on or off.

Logging In

Process for entering a PIN to access secure settings and features.

Logging Out

Procedure to exit the security session and return to normal operation.

Troubleshooting

Tracer AdaptiView display troubleshooting guide

A guide to identify and resolve common issues with the Tracer AdaptiView display.

Appendix: Data for CenTraVac chillers

Component Screen Data

Lists settings and status points available for each chiller component on its screen.

Items available to include in custom reports

Lists all data points that can be selected for custom reports.

Data Graph Data Points

Specifies data points used in default graphs and available for custom graphs.

Data Points Available to Include in Custom Data Graphs

Comprehensive list of data points usable in custom data graphs, organized by component.

Trane AdaptiView Specifications

General IconGeneral
Display TypeLCD
User InterfaceTouchscreen
ConnectivityEthernet
CompatibilityTrane
Operating Temperature0° to 50°C (32° to 122°F)
Power Supply24 VAC
Humidity Rangenon-condensing

Related product manuals