26 CTV-SVU02A-EN
Data Graphs
You can use the Tracer AdaptiView display to view a variety of default data graphs and to create
up to six custom data graphs with up to eight data points per graph. The data sample rate is 30
seconds, and the data storage duration is 48 hours. These rates cannot be adjusted.
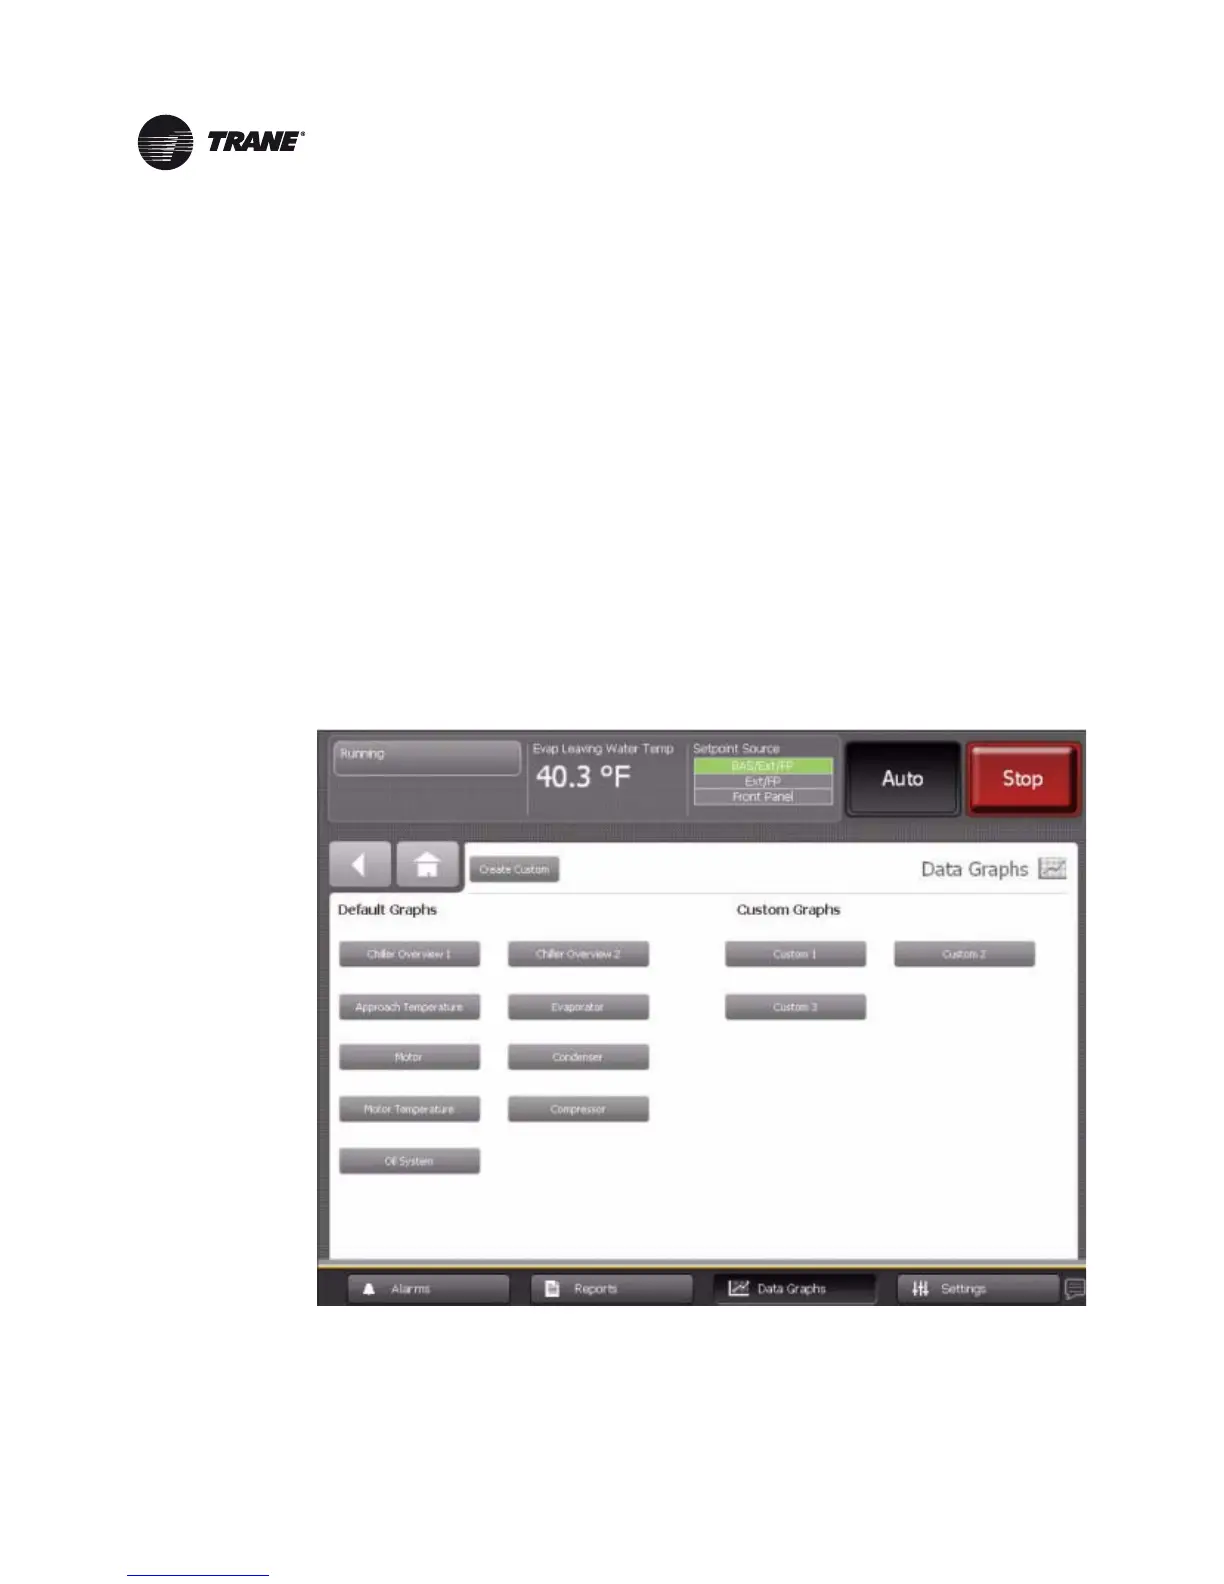
Viewing the Data Graphs Screen
Touch the Data Graphs button in the main menu area (Figure 1, p. 7) to view the Data Graphs screen
(Figure 11). Each button on the screen links to a data graph.
The buttons under the Default Graphs heading are:
When you create custom graphs, they appear under the Custom Graphs heading with names such
as “Custom 1” and “Custom 2,” as shown in Figure 11.
• Chiller Overview 1
• Chiller Overview 2
• Approach Temperature
•Evaporator
• Motor
• Condenser
• Motor Temperature
• Compressor
•Oil System
Figure 11. Data Graphs screen