CTV-SVU02A-EN 29
Data Graphs
6. Touch Save. The data graph appears with changed Y-axes scales.
Creating Custom Data Graphs
You can create a custom data graph in two ways:
• By starting with a default data graph
• By starting from a blank screen, with no previously defined data graph points
Creating a custom data graph from a default data graph
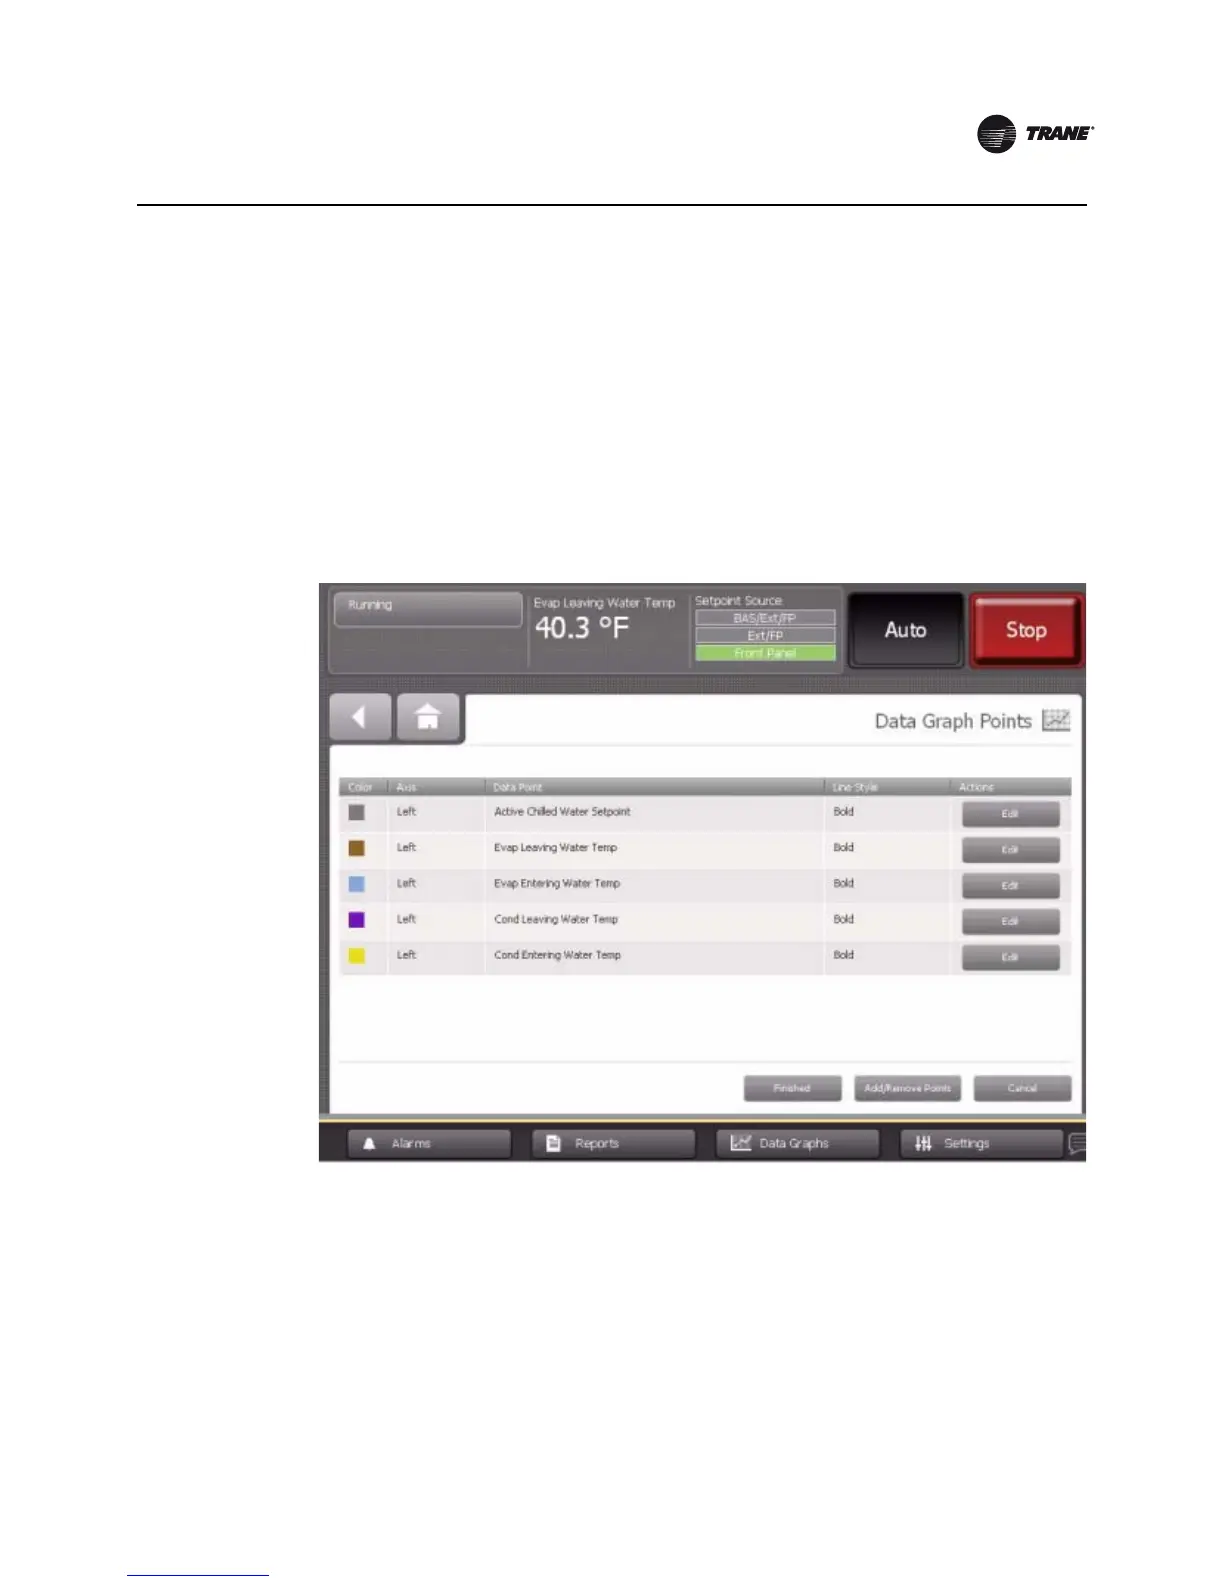
1. Touch the Create Custom button at the top left of any default data graph screen (see Figure 12,
p. 27, for example). The Data Graph Points screen appears (Figure 14).
2. Touch the Add/Remove Data Points button at the bottom of the screen. The Add/Remove screen
appears (Figure 15, p. 30), pre-populated with data points from the default data graph you
chose.
Note: When you save the graph, a new custom graph is created; the default data graph is not
overwritten.
3. Touch the up/down arrows at the top of the left box on the Add/Remove screen to scroll through
a list of chiller components. The list of items in the box just below the up/down arrows changes
to correspond to the component choice. (For reference, these items are listed in “Appendix:
Data for CenTraVac chillers,” p. 57).
Figure 14. Data Graph Points screen