32 CTV-SVU02A-EN
Data Graphs
Editing Custom Data Graphs
You can edit custom data graphs by:
• Changing the scales of the X-axis and Y-axes (follow the procedures in
“Changing the Scales
on Data Graphs,” p. 27).
• Changing the:
– Line style between bold and normal
– Y-axis location between left and right
– Line color
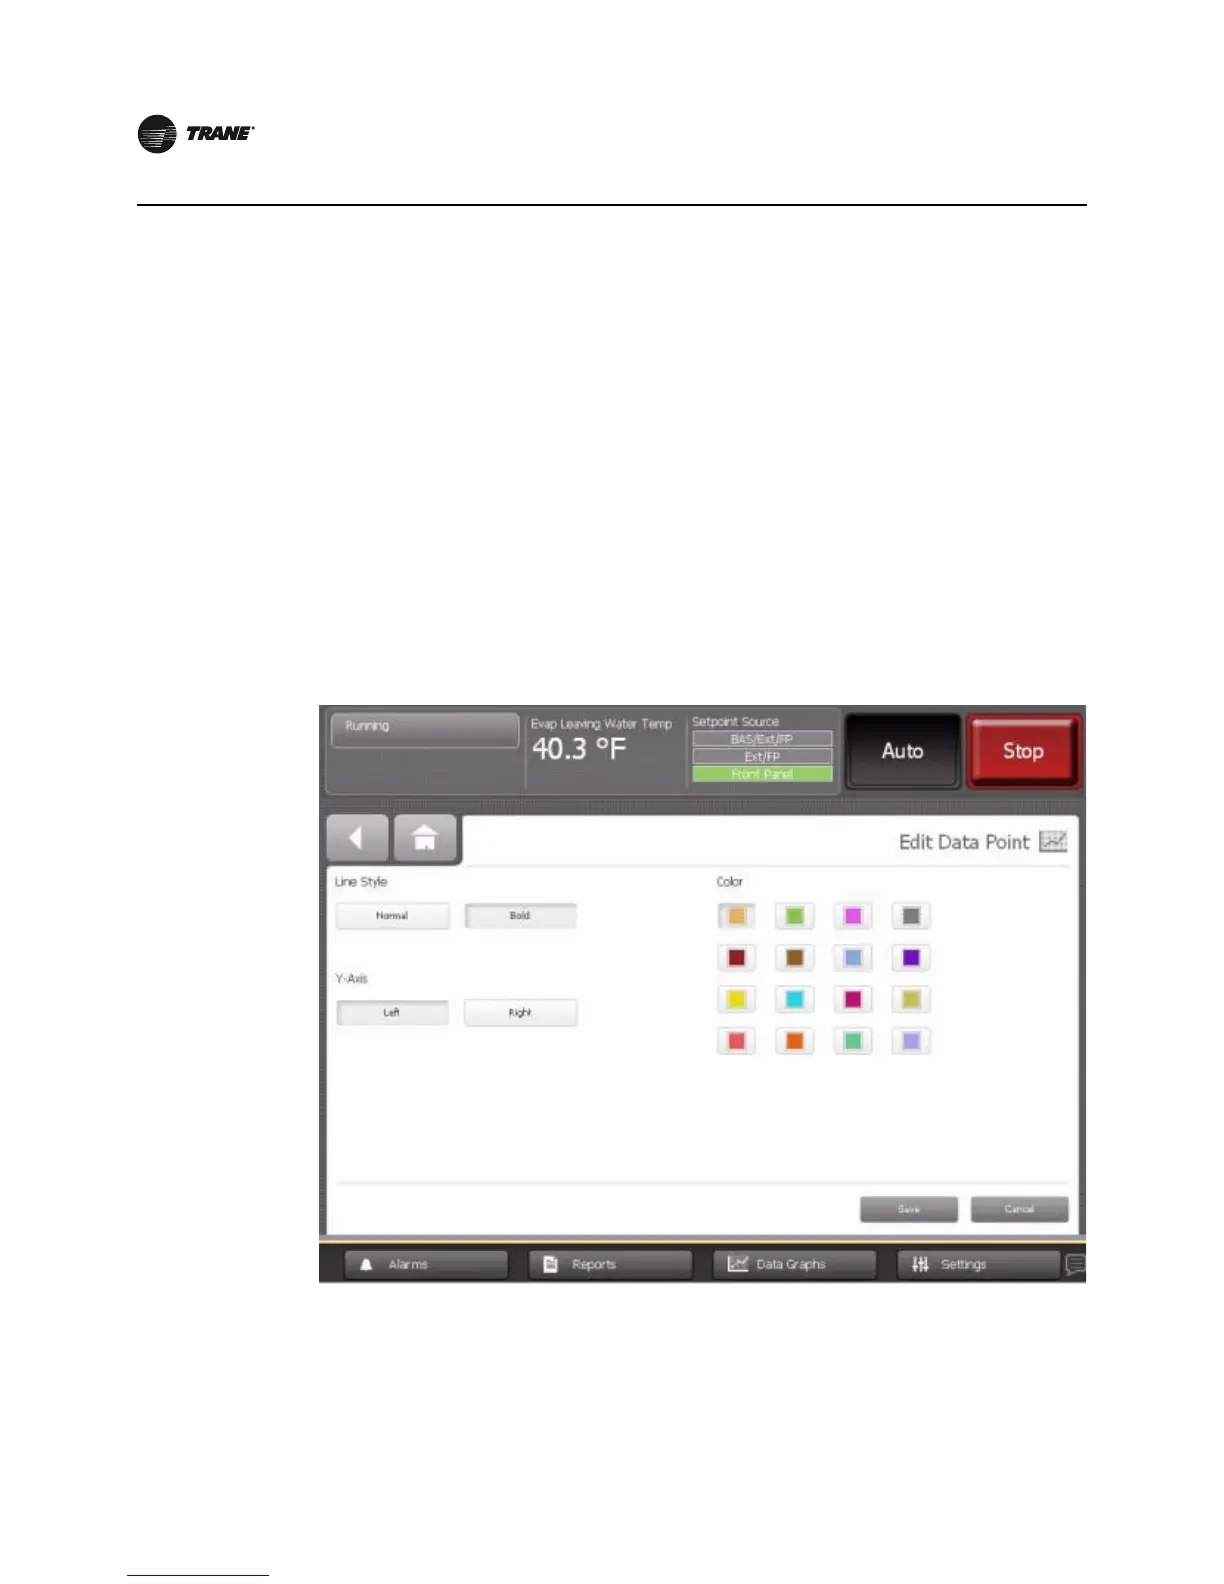
1. To edit a data point, touch the Edit button in the row for the data point you want to edit. The
Edit Data Point screen appears (Figure 17, p. 32).
2. Touch the button in each category—Line Style, Y-Axis, Color—that represents how you want the
graph to appear. The buttons you select become shaded.
3. Touch Save. The screen you were previously viewing appears with your changes reflected in
the table.
Deleting a Custom Data Graph
Touch the Delete button at the top of a custom graph screen to delete the custom graph.
Figure 17. Edit Data Point screen