28 CTV-SVU02A-EN
Data Graphs
To change the scale, touch the plus or minus button in the magnifying glass in the lower left corner
of a data graph that you want to edit (see
Figure 12, p. 27 as an example). The slider scale moves
to the right or left as you touch either the plus or minus button. The time scale for the X-axis changes
in response.
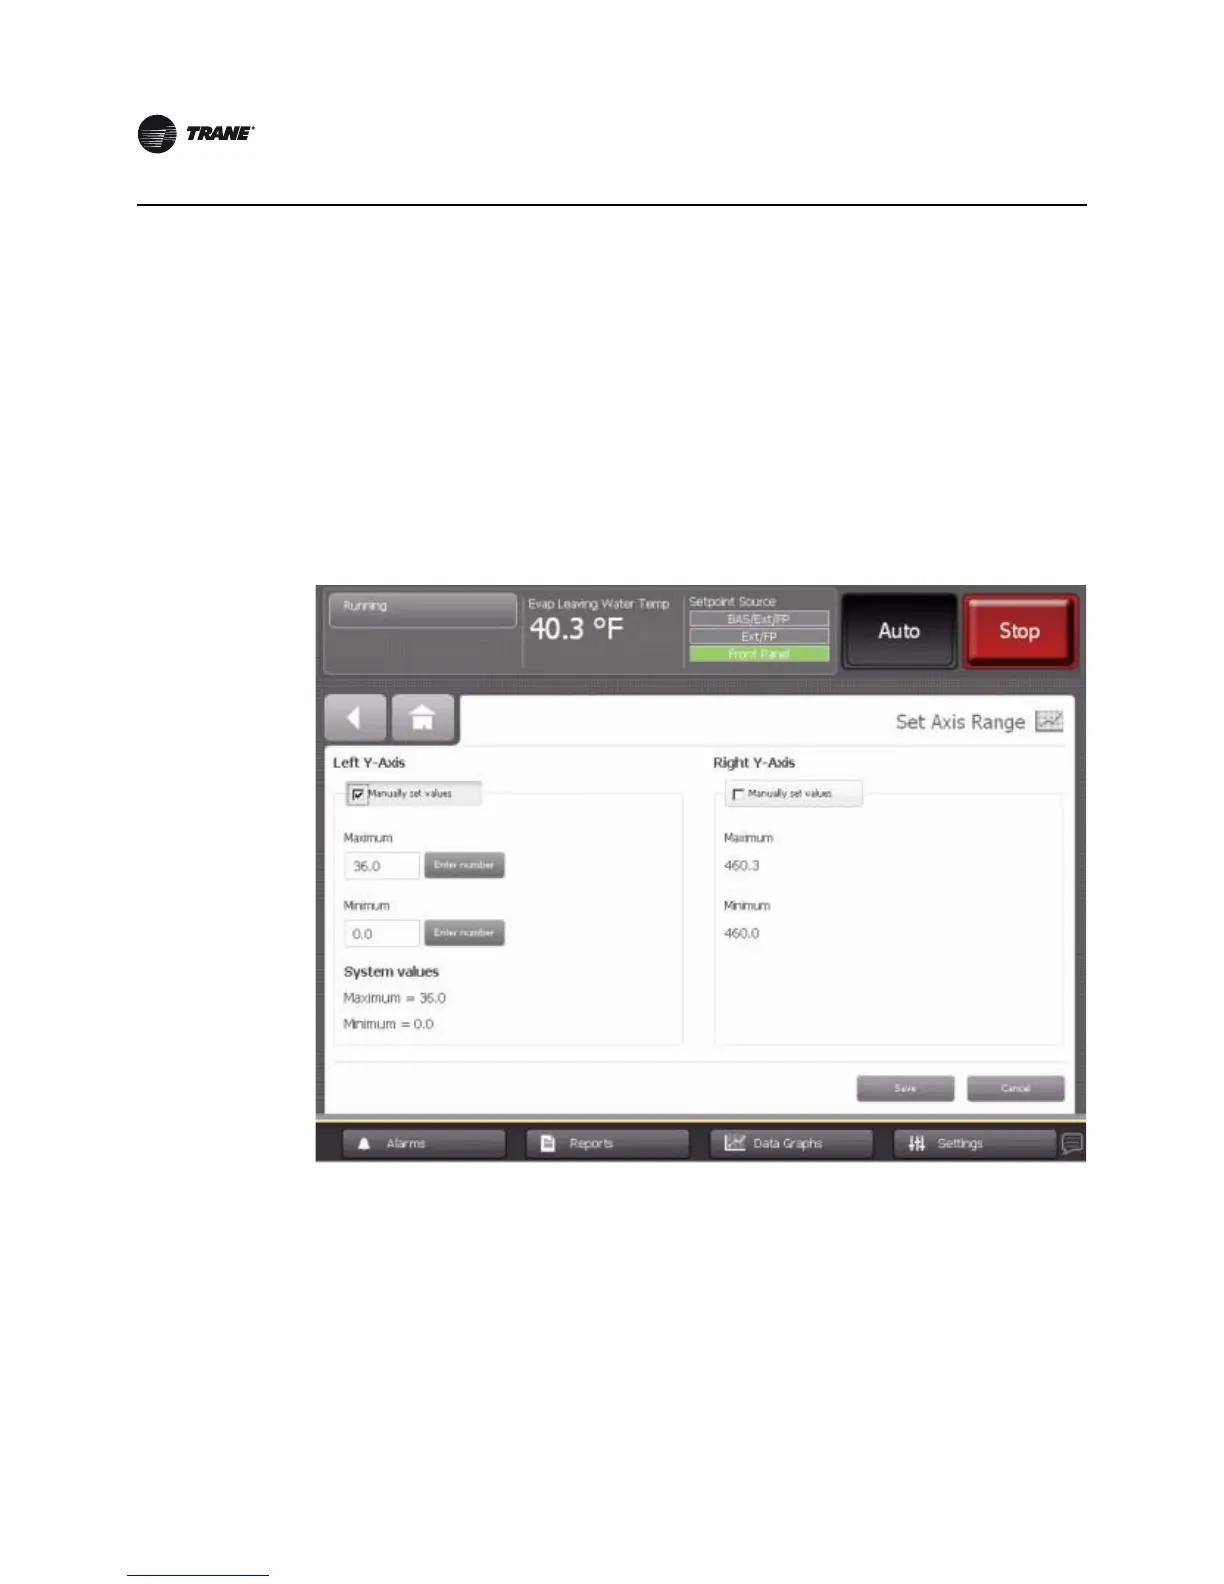
Changing the scale of the Y-axes
The Y-axes scales have a default range that varies for each data graph. You can change the range
for each graph.
1. Touch the Edit Y-Axis button at the bottom of a data graph that you want to edit (see Figure 12
as an example). The Set Axis Range screen appears (Figure 13). The screen shows the
minimum and maximum values for that particular graph.
2. Touch the Manually set values button under either the Left Y-Axis or Right Y-Axis heading. Enter
number buttons appear to the right of the minimum and maximum values.
3. Touch the Enter number button for the value you want to change. A keypad appears on the
screen.
4. Touch the appropriate numbers to change the current value. The new value appears above the
keypad.
5. Touch the Enter button. The graph you were previously viewing appears with changed
maximum and/or minimum values.
Figure 13. Set Axis Range screen