UPM 1400
EN 16
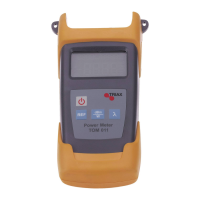
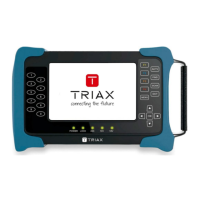
Satellite, spectrum
The signal spectrum shows a graphical representation of the signal carriers on a certain satellite polarization in a
certain frequency band.
The selected frequency is displayed via a cursor in the form of a green line.
The desired carrier or the desired frequency can be selected with the left/right cursor keys. Signal level range can be
changed with up/down arrow keys.
Function Key Options:
F1 - stops real-time analysis (freeze) and displays values when stopped
F2 - connects to the selected transponder (channel analysis) and evaluates the data
F3 - access to setting the center frequency range and the span (analysis width)
F4 - other functions
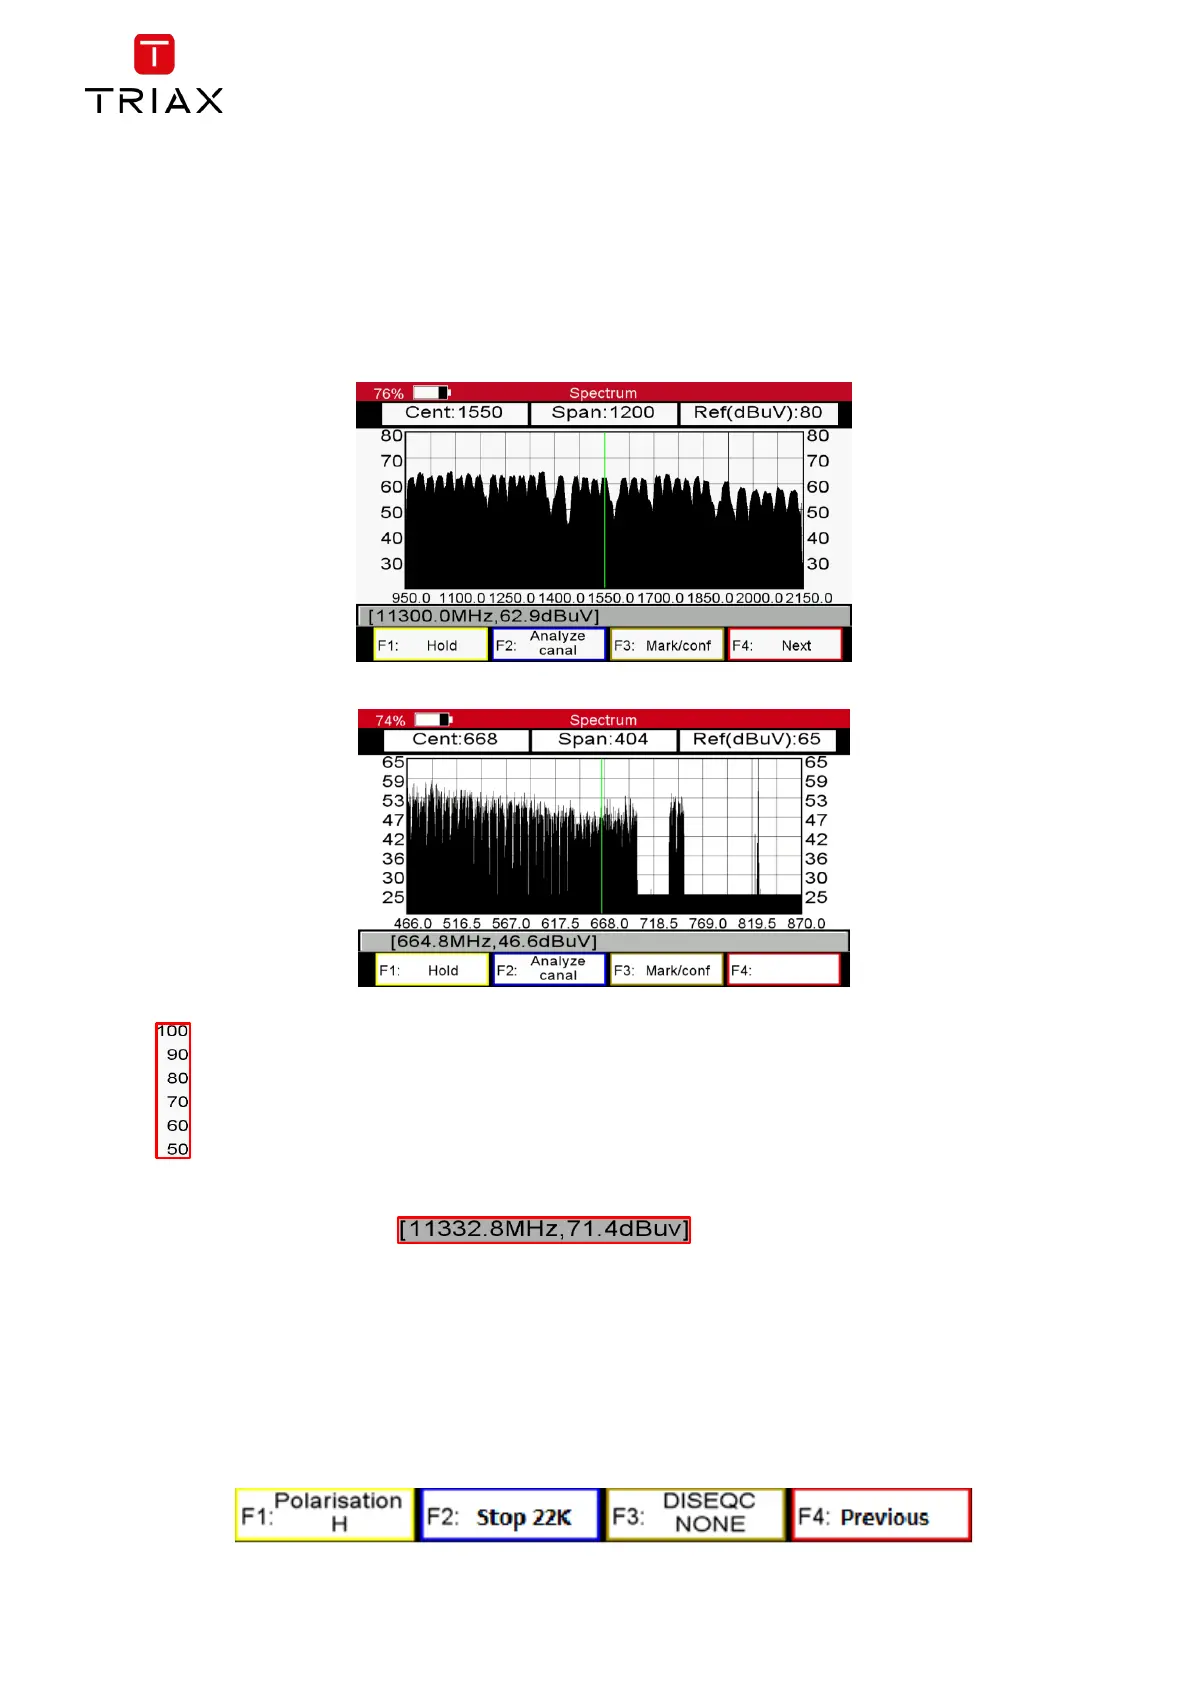
The F4 key expands setting options as:
F1 - changes in horizontal or vertical polarization
F2 - activates or deactivates 22 KHz to switch to low or high band
The values below the graph represent the
transponder frequency and signal level
from the cursor positions.
 Loading...