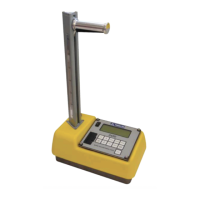
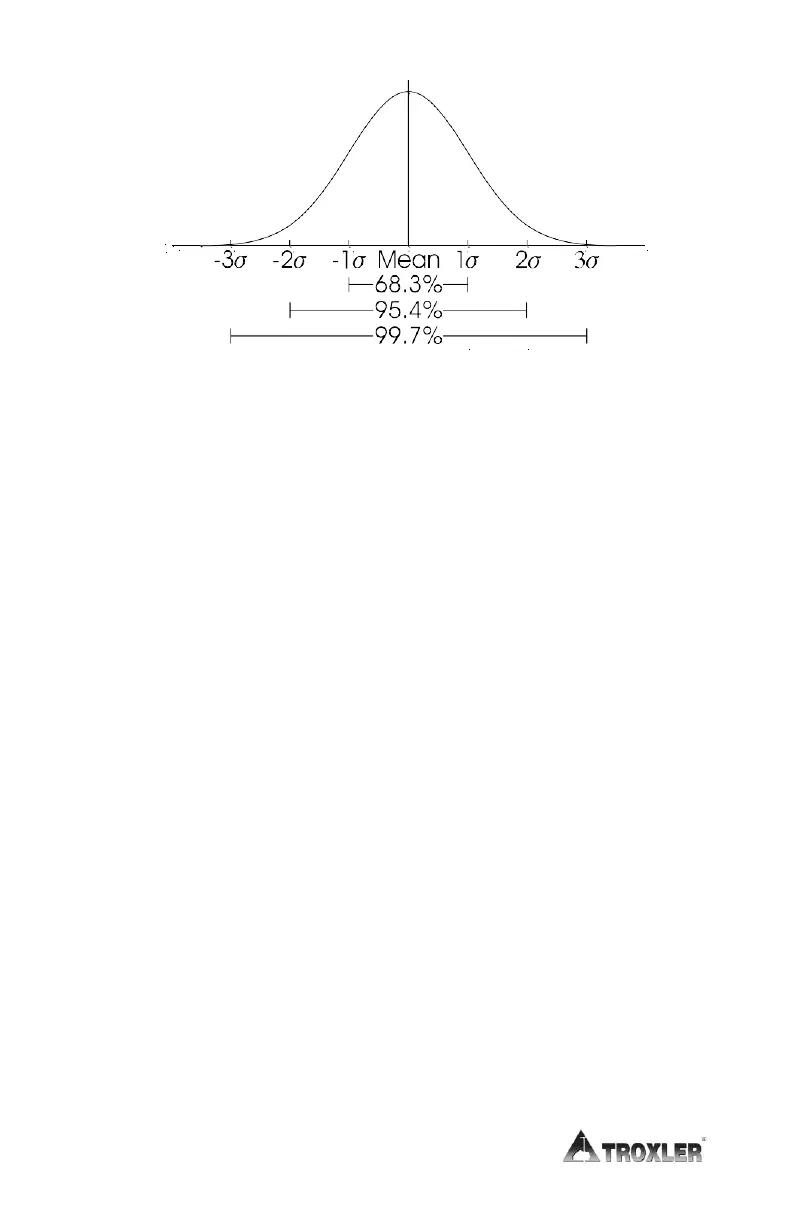
Normal Distribution
Figure 10. Variation of Radioactive Emission
Using the mean of a larger number of counts to approximate the
true mean, the distribution shows that 68.3% of the time the
count rate obtained will be within ±1 standard deviation of the
mean. Figure 10 shows the chance of counts falling within three
standard deviations. A statistical stability test may be performed
to compare the experimental standard deviation to the
theoretical standard deviation (see page 7-2).