54
6 Set up with the display and adjustment module
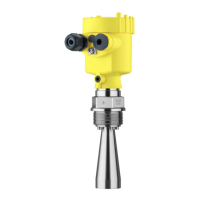
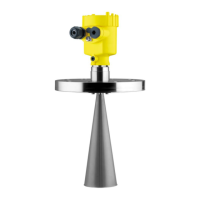
VEGAPULS 68 • Foundation Fieldbus
36538-EN-170405
How to start the simulation:
1. Push [OK]
2. Select the requested simulation variable with [->]andconrm
with [OK].
3. With [OK]youstartthesimulation,rstofalltheactualmeasured
value is displayed in %
4. Start the editing mode with [OK]
5. Set the requested numerical value with [+] and [->]
6. Push [OK]
Note:
Duringsimulation,thesimulatedvalueisoutputtedasProbusPA
signal.
How to interrupt the simulation:
→
Push [ESC]
Information:
The simulation is automatically terminated 10 minutes after the last
pressing of a key.
The "Echo curve" shows the signal strength of the echoes over the
measuring range in dB. The signal strength enables an evaluation of
the quality of the measurement.
The "False signal suppression" displays the saved false echoes (see
menu "Additional settings") of the empty vessel with signal strength in
"dB" over the entire measuring range.
A comparison of echo curve and false signal suppression allows a
more detailed statement about measurement reliability.
Theselectedcurveiscontinuouslyupdated.Asubmenuwithzoom
functions is opened with the [OK] key:
•
"X-Zoom":Zoomfunctionforthemeas.distance
•
"Y-Zoom":1,2,5and10xsignalmagnicationin"dB"
•
"Unzoom":Resetthepresentationtothenominalmeasuringrange
withoutmagnication
Diagnosis - Curve indica-
tion

 Loading...