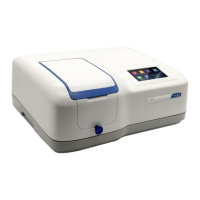
2. Click the icon in the Tools Bar Shortcut to set the parameters of Quantitative Analysis.
Choose test method;
Input test wavelength in WL Frame;
Choose the Concentration Unit ;
Choose curve fitting method;
Create Standard Curve
Two methods are under your choice to create a new curve.
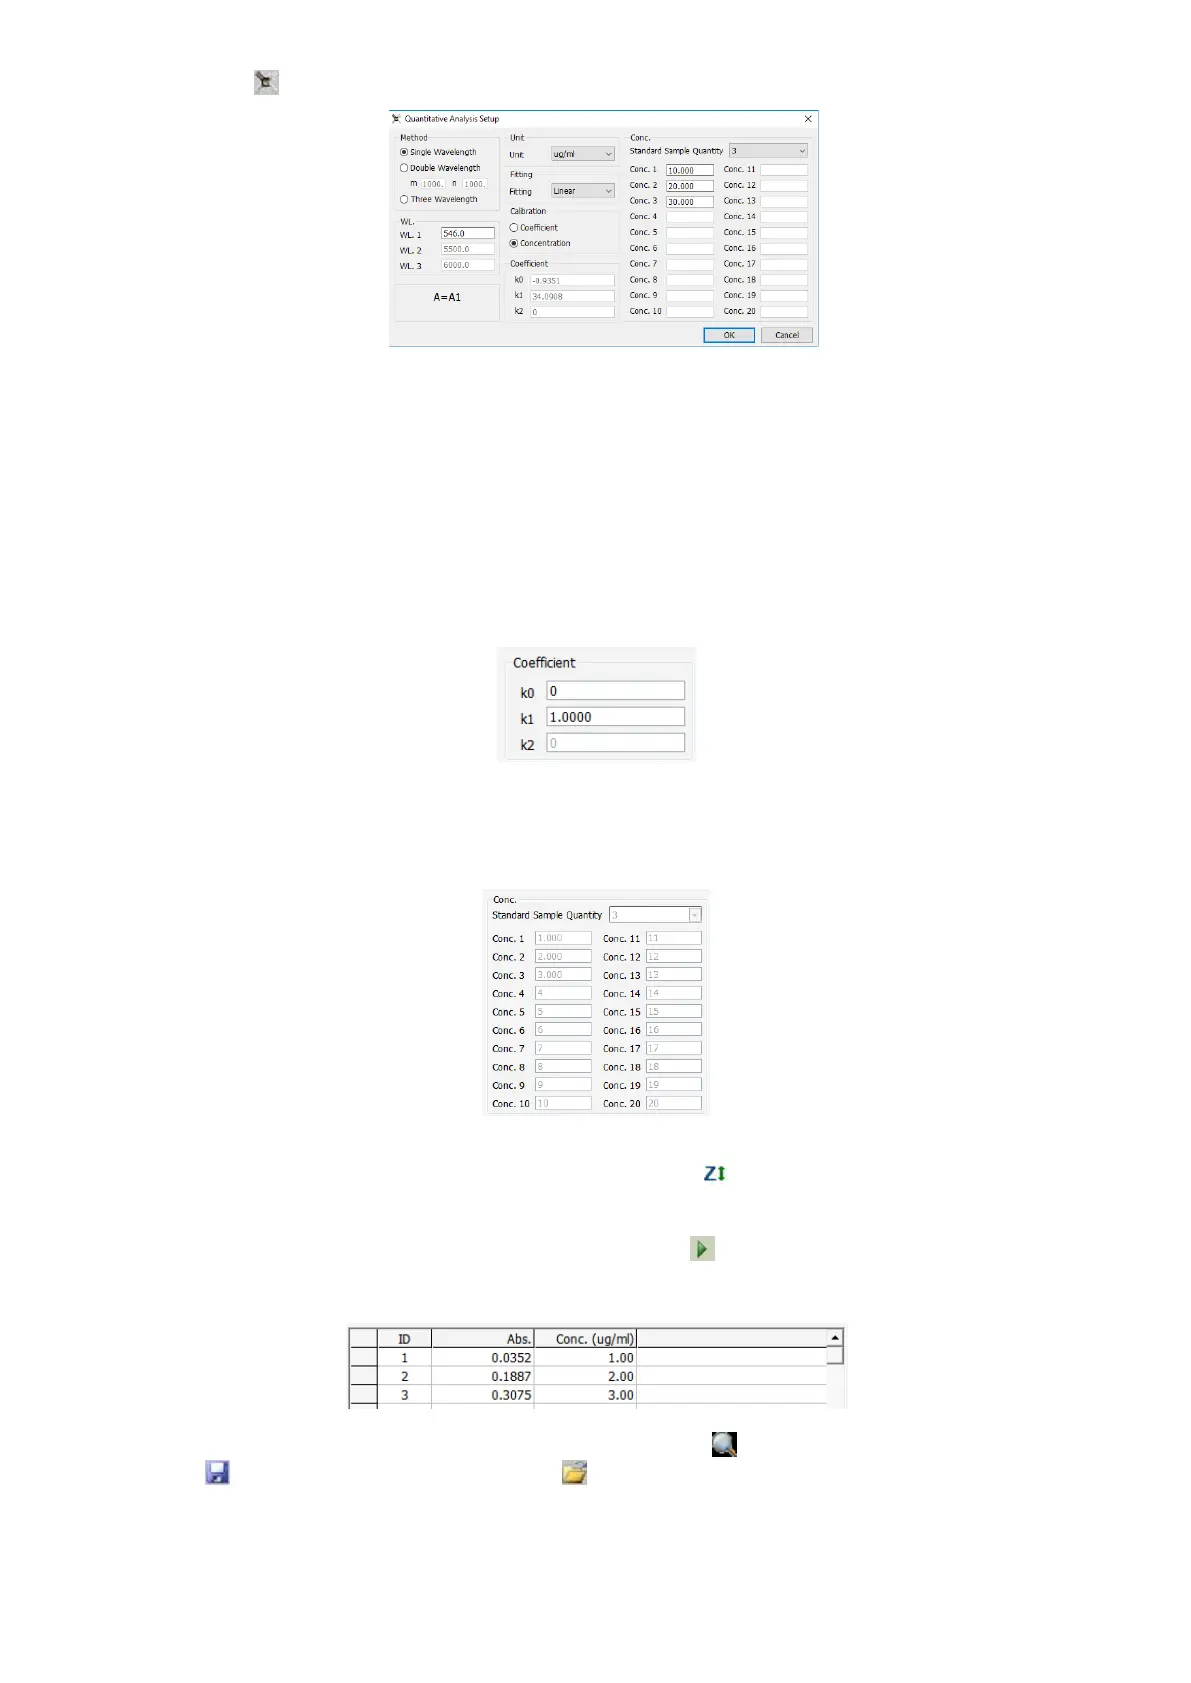
Method 1: Coefficient
(1) Click Coefficient option;
(2) Click Fit Method to choose Fit Curve method;
(3) Input the curve equation’s coefficients in corresponding frames;
(4) Click OK to finish setting.
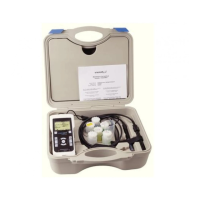
Method 2: Use Standard Samples to create a new curve
(1) Click Standard Sampling option;
(2) Click Standard Sample Quantity to choose the quantity(≤20);
(3) Input the sample concentration in corresponding Frame;
(4) Click OK to finish setting;
(5) Pull the Reference into the light path and click the icon , then the system will move the wavelength
to the one you just set, it blanks then;
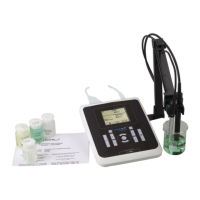
(6) Put 1# standard sample into the light path and move the cursor on the fist frame of Abs. The sample
Absorbance value will appear in this frame after click in the shortcut toolbar;
(7) Measure other standard samples in the same way as step (6) shows. The curve displays automatically
when finish;
You can modify the curve’s coordinates by Clicking the icon . You can also save the curve by
clicking , and you can reload it by clicking next time.