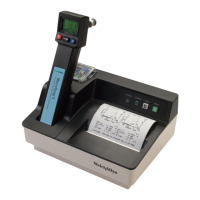
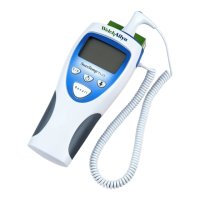
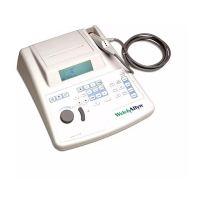
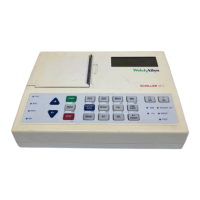
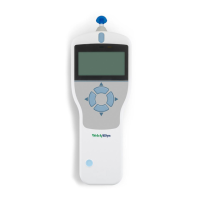
Welch Allyn MicroTymp® 4 Tympanometer
User Manual
DIR 80024157 Ver A Page 20
The Gradient, in daPa (Gr)
The Ear Canal Volume (ECV) in ml measured at 200 daPa
A plot of admittance against pressure
The normalized rectangle showing the ideal location for the tympanogram peak
Review the tympanogram to ensure that the peak admittance point selected by the MicroTymp
4 is suitable. If required, it is possible to select an alternative peak using the ▲ and ▼ keys. The
figures displayed will change to reflect the peak selected and will be saved with the
tympanogram.
To repeat the test, press ◄.
When satisfied with the tympanogram press ►.
If the reflex test was carried out the results will now be displayed:
The display shows:
The frequency of the reflex stimulus
“” if a reflex was found, otherwise “X”
The lowest level of tone (dBHL) at which a reflex was found
A trace of the admittance change against time
If the reflex test was performed at a single frequency use the ▲ and ▼ keys to view the results
for each of the reflex tone levels used. If the reflex test was performed at more than one
frequency use the ▲ and ▼ keys to view the results for the other frequencies.
If the MicroTymp 4 was set to test for a reflex at all levels of the stimulus (see Reflex Autostop)
press ► to view an additional display following the reflex graphs. This shows a summary of the
levels and frequencies at which a reflex was detected. The dash symbol “-” is shown if a reflex
tone was not presented at the level indicated.
 Loading...