Air pressure trend
When the air pressure rises again, the symbol will be displayed continuously again.
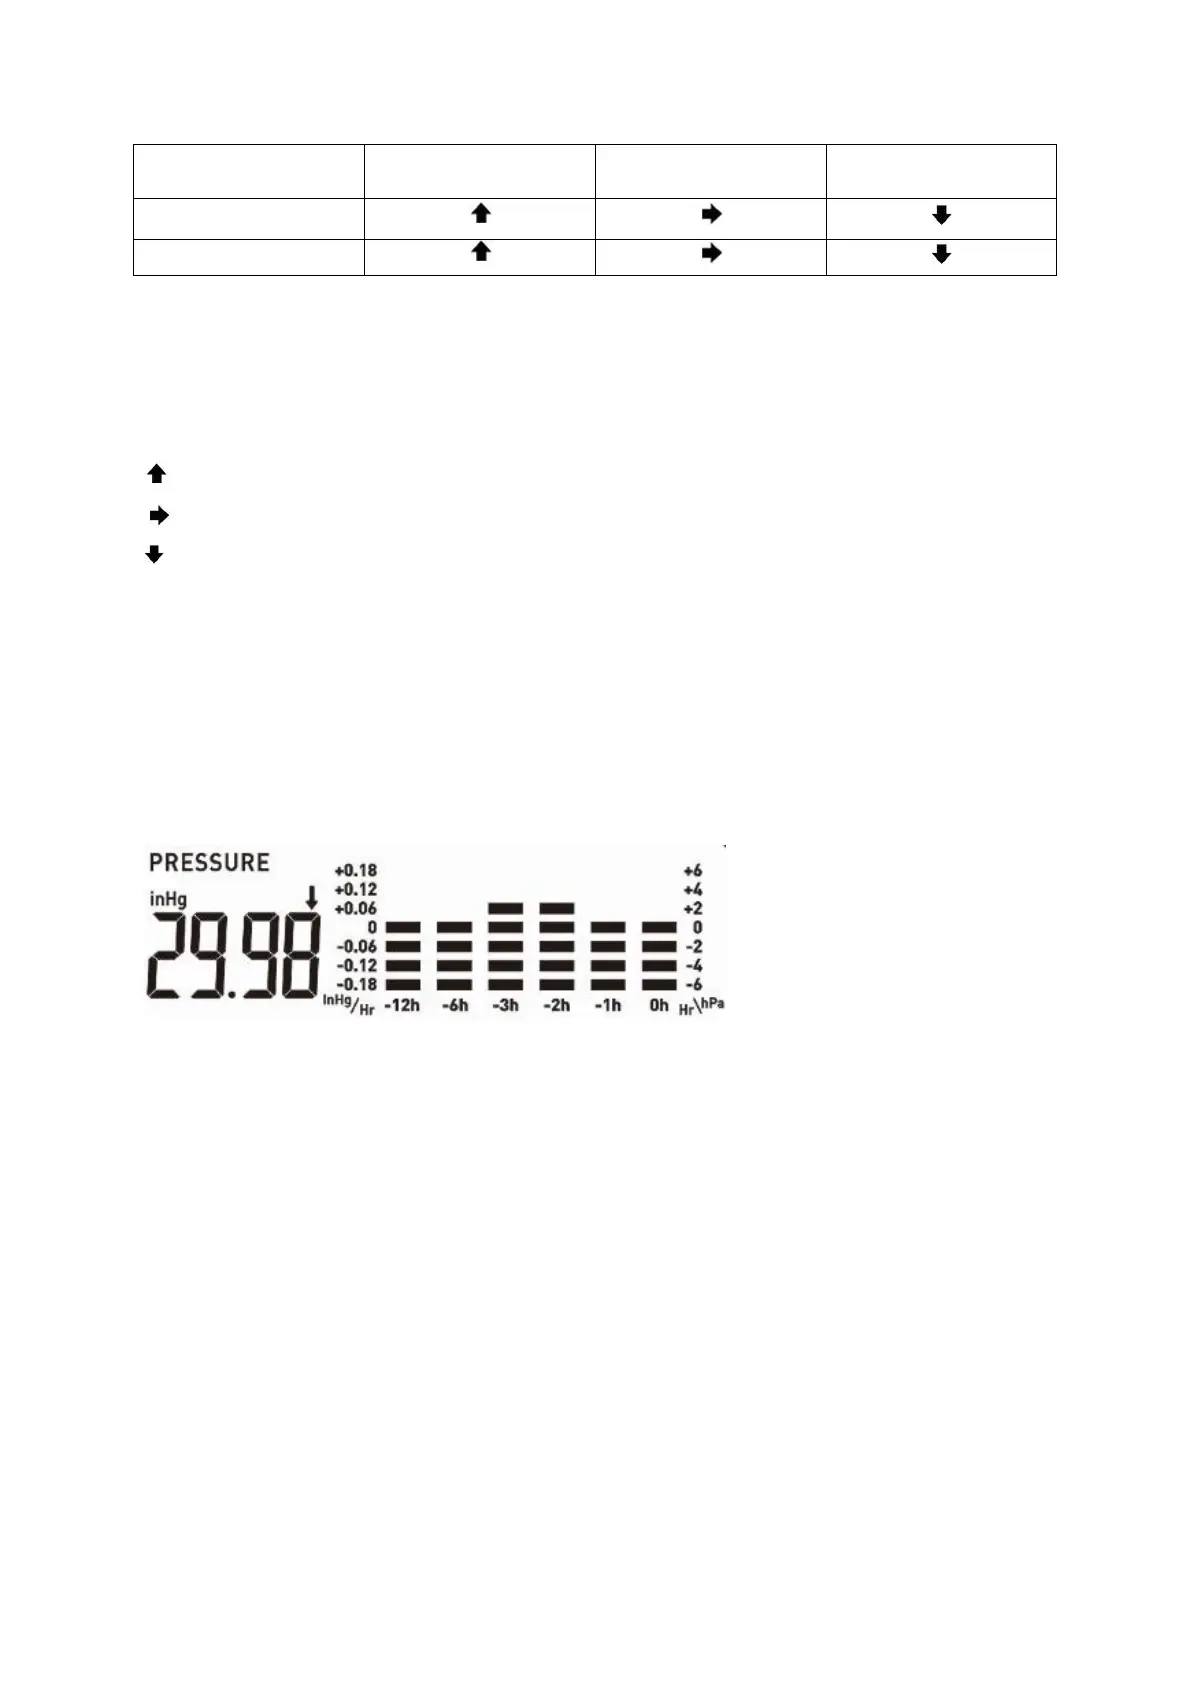
The arrow shows the weather trend. If it points upwards or downwards, it means that the weather rises or
falls by more than 0.06 inHg (2 hPa) in an hour.
rising air pressure = weather rises
constant air pressure = weather stays the same
falling air pressure = weather falls
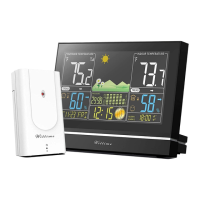
Pressure readings
History Graph:
• Read from left to right, your Pressure History Graph indicates the rise and fall in air pressure over the past
12 hours.
• The numbers below represent the hour in which the reading was taken. The “0H” is the current pressure
level. “-3H” was the reading taken three hours ago, compared to current pressure.
Weather forecast
After setting up initially, the weather forecast can not be used for about 12 hours, as the weather station
needs this time to collect and evaluate the weather data.
The weather forecast is a result of the collected data and the measured changes in air pressure.
The forecast refers to the area around the weather station with a radius of about 30 to 50 km for the next 12
to 24 hours.
The accuracy of the weather forecast is around 75 %.