Do you have a question about the Aaronia SPECTRAN NF and is the answer not in the manual?
Steps to prepare the SPECTRAN device for its first measurement, including display film removal and power activation.
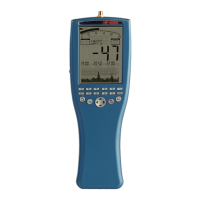
Details key aspects of the SPECTRAN display, including bargraph, mode fields, info display, and main display.
Explains how to select the appropriate sensor (Mag, MSta, E-Fld, Analog) for different types of field measurements.
Details the three main operating modes: SPECTRUM analysis, EXPOSURE LIMIT display, and AUDIO output.
Describes how to use the Spectrum analysis mode, including display interpretation and measurement completion.
Explains how to activate and use the HOLD mode to freeze the display and capture the highest signal readings.
Details the panning approach for evaluating exposure limits, involving measuring maximum signal levels across an area.
Describes the EXPOS.-LIMITS mode, showing signal strength as a percentage of defined exposure limits.
Details the demodulator function, allowing audible reproduction of signal pulsing and modulation via AM or FM.
Describes how to recall pre-defined frequency range presets for common measurements.
Explains how to manually set the start and stop frequencies for precise measurement of specific signal sources.
Step-by-step guide on setting the start (fLow) and stop (fHigh) frequencies for manual frequency sweeps.
Explains how to choose the appropriate filter bandwidth (RBW) and sample time (SpTime) for accurate measurements.
Details how to save custom frequency setups as hotkeys and switch between Spectrum analysis, Exposure limits, and Audio modes.
Explains how to access and navigate the SPECTRAN menu system using keys, jog dial, and enter key.
Details how to select the internal sensor (Mag, MSta, E-Feld) or external input (Analog) and measurement axes (1D, 2D, 3D).
Explains how to set the center frequency for evaluating different frequency ranges with a fixed SPAN.
Describes how to adjust the span (sweep width) to change the resolution and detail of the displayed spectrum.
Explains how to define the complete frequency range by setting the start (fLow) and stop (fHigh) frequencies.
Details how adjusting the bandwidth (RBW) affects detail clarity and sensitivity, influencing sweep speed and accuracy.
Explains how to select the measurement dimension (1D, 2D, or 3D) for magnetic field analysis.
Describes the Video filter's function for optical smoothing of signals, suppressing noise and harmonics.
Explains how sample time affects measurement accuracy and sweep speed, detailing available settings.
Details how to set the reference level to adjust the display position of signals and filter out background noise.
Explains the demodulator function for audible reproduction of signal modulations and its two modes: AM and FM.
Describes the RMS and MinMax detectors for analyzing signal modulation and identifying signal characteristics.
Explains how to activate HOLD mode for capturing and displaying persistent signal data, useful for event recording.
Details how to select the physical unit (Tesla, Gauss, A/m, V/m) for displaying measurement results.
Explains how to set the scaling prefix (p, n, μ, m, k) for physical units to simplify display.
Details how to set the number of markers (1, 2, or 3) to display on the spectrum for analysis.
Explains how to set the signal strength threshold for marker generation and exposure limit calculations.
Describes the two marker display modes: Frequency (Freq.) and Amplitude (Ampl.) for optimal readability.
Explains how to adjust the display brightness using the Jog Dial for optimal visibility.
Details how to use the logger function for long-term recording of signals, including setting parameters like count and time.
Explains how to run pre-loaded or saved programs and configurations on the SPECTRAN device.
Details how to manage and save individual configurations, programs, and factory settings.
Explains the concept of noise floor and its impact on measurement accuracy, especially at lower frequencies.
Discusses the 0Hz spike phenomenon and how proximity to 0Hz affects measurement accuracy and sensitivity.
Provides guidance on using the smallest possible SPAN when measuring near the 0Hz spike to reduce the noise floor.
Advises against starting measurements at 0Hz and suggests alternative ranges for better accuracy.
Explains how to select the appropriate filter (RBW) based on SPAN, impacting sweep speed, accuracy, and sensitivity.
Details how to choose the correct sample time (SpTime) for accurate level measurements, especially with low RBWs.
Provides guidance for accurate measurement of electric fields and fields above 500kHz, emphasizing distance and handling.
Safety and best practices for manual measurements, including avoiding interference and proper device handling.
Discusses how sensitivity is affected by frequency, noise floor, and filter settings.
Explains factors contributing to measurement inaccuracy, particularly at noise floor or highest measurable levels.
Details how to use the cursor for precise frequency/level determination and zoom features for signal analysis.
Explains the DFT mode for fast measurements with narrow filters, automatically activated under specific settings.
Guides on selecting the appropriate internal attenuator to prevent amplifier overdrive and ensure accurate measurements.
Explains the Autorange function for automatically adjusting prefixes to display values within the 4-digit limit.
Discusses spurious signals from the device's own circuits and future software improvements for their removal.
Explains how to activate the static magnetic field sensor and set the appropriate axes for measurement.
Details the measurement of static magnetic fields, including geomagnetic fields and their variations.
Describes the integrated 3D coil for isotropic magnetic field measurement in all directions (axes).
Explains the formula for calculating the quadratic mean for 2D and 3D magnetic field measurements.
Provides guidance on aligning the device for optimal E-field sensor measurements, focusing on the Y axis.
Explains how to align the device for H-field measurements, noting the sensor location and axis requirements.
Details alignment procedures for the M-field sensor (static magnetic fields), including axis orientation.
Explains how to measure field strength in various units and the use of the autorange feature.
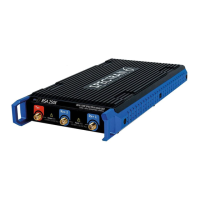
Describes measuring voltage via the SMA connector and the optional Differential Probe for expanded range.
Provides tips on adjusting sample time, filter, and SPAN settings to achieve faster sweep speeds.
Explains how to map keys with custom configurations and use PC software for advanced settings.
Advises setting marker level higher for sensitivity when calculating exposure limits for weak signals.
Explains how to use HOLD mode to convert measurement results into different physical units.
Recommends using free PC analysis software (LCS/MCS) for optimal use of SPECTRAN's capabilities.
Details international and German exposure limits for personal safety based on frequency ranges and affected groups.
Explains device-specific limits, such as MPR2 and TCO99, which are often more restrictive than personal safety limits.
Discusses construction-biological and precautionary limits, noting their lower values and lack of frequency components.
Details the SMA input for connecting external sensors and measuring signals in volts, with warnings about input voltage.
Explains the DC input for battery charging and operating the device with an external power supply.
Describes the standard 2.5mm stereo jack for audio output to external devices.
Explains the Jog Dial's dual function for menu navigation and volume control, with a precaution for audio output.
Details the USB connector for fast communication with computers, data transfer, and software updates.
Provides examples of typical field strength readings measured close to various common appliances.
Shows typical field strength readings taken at different distances from high-voltage lines and substations.
Provides conversion factors for magnetic field units like Tesla, Gauss, Oersted, and their prefixes.
Offers conversion factors for electric field units like V/m and their relation to kV/m.
Lists gain values and their corresponding dB (decibel) representations.
Shows conversions between dBm, dBW, and Watts, including common prefixes for power.
Lists frequency ranges with corresponding wavelengths and official radio band abbreviations.
Lists common interference sources with their typical operating frequencies for identification.
Illustrates the relationship between magnetic field strength and distance from sources like conductors and coils.
Explains frequency ranges as reserved bands for applications to avoid interference, using a motorway analogy.
Highlights the significant differences in exposure limits for various applications based on frequency and field strength.
Explains spectrum analysis as a range analysis, breaking down signals into frequency bands and evaluating their strength.
Illustrates how to display signal strength using vertical bars and markers based on frequency ranges and applications.
Explains how bar height represents signal strength and markers show frequency/amplitude, enabling signal identification.
Details how to use frequency tables to identify the source of detected signals based on their frequencies.
Explains the service for upgrading to newer SPECTRAN models by paying the price difference.
Describes product replacement options when new models are launched, including trade-in benefits.
States the 10-year warranty provided for all SPECTRAN instruments and the prompt exchange of defective units.
Highlights the spectran-developer.net website for firmware updates, PC software, SDK, and user forum access.
Provides a chart showing frequency ranges covered by different SPECTRAN Spectrum Analyzer models.
Presents frequency charts for HyperLOG and BicoLOG antennas and probes, categorized by frequency bands.
| Brand | Aaronia |
|---|---|
| Model | SPECTRAN NF |
| Category | Measuring Instruments |
| Language | English |