51
USING ADOBE AUDITION
Editing audio files
Last updated 2/16/2012
0 dB Reference Determines the amplitude at which full scale, 0 dBFS audio data is displayed. For example, a value of
zero displays 0 dBFS audio at 0 dB. A value of 30 displays 0 dBFS audio at –30 dB. This value simply moves the graph
up or down; it does not change the amplitude of audio data.
Adjust the 0 dB Reference to calibrate this display to another decibel reference, like sound pressure level (SPL).
Value at [x] Hz Reveals precise amplitude for specific frequencies when you position the mouse over the graph.
Overall Frequency For the start point of a selected range, indicates average frequency.
Overall Musical Note For the start point of a selected range, indicates keyboard position and variance from standard
tuning (A440). For example, A2 +7 equals the second-lowest A on a keyboard tuned 7% higher than normal.
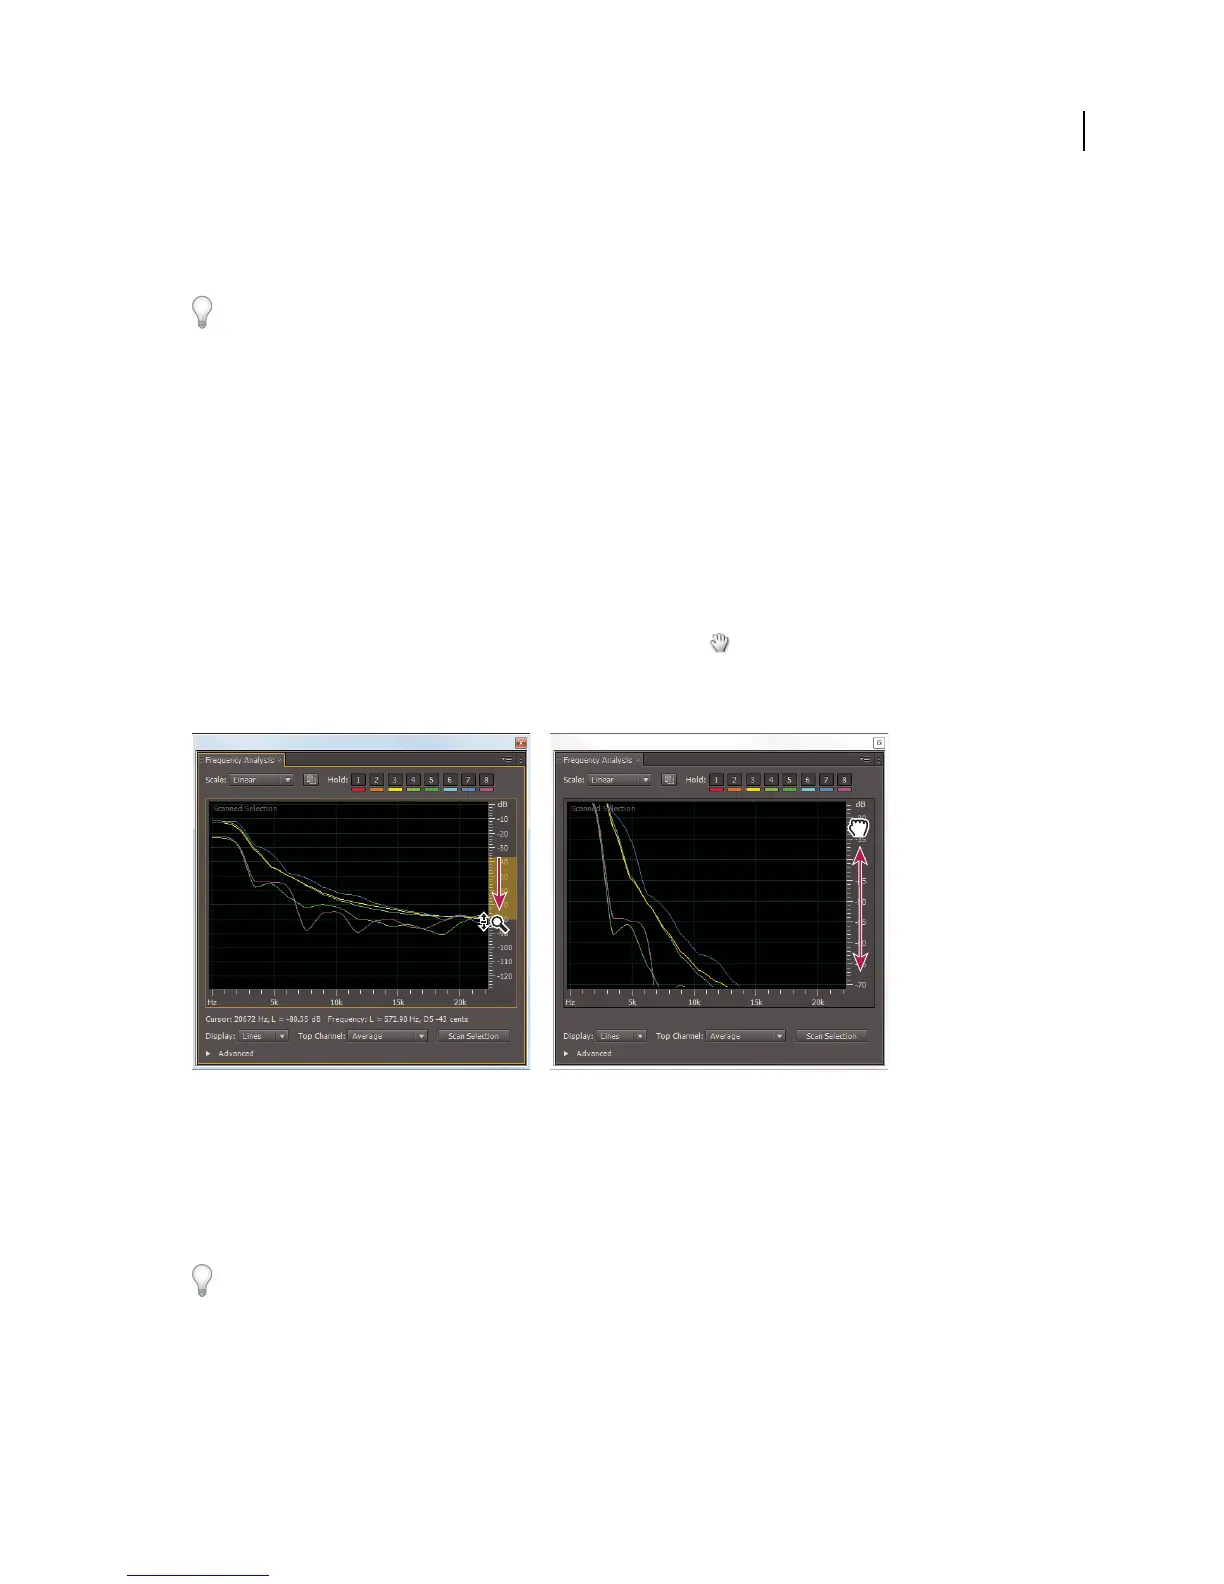
Zoom frequency graphs
In the Frequency Analysis panel, you can zoom graphs to analyze frequency in more detail.
❖ Do any of the following:
• To zoom in on a graph, right-click and drag the magnifying glass icon in the vertical or horizontal ruler.
• To navigate a magnified graph, left-click and drag the hand icon in the vertical or horizontal ruler.
• To zoom out on a magnified graph, right-click in the vertical or horizontal ruler, and choose Zoom Out to return
to the previous magnification, or Zoom Out Full to zoom out completely.
Zooming and navigating a Frequency Analysis graph
Analyze amplitude
1 In the Waveform Editor, choose Window > Amplitude Statistics.
2 To calculate statistics from an entire file or selection, click Scan or Scan Selection. (By default, statistics are
calculated from the center point of files and selections.)
You can adjust a selection in the Editor panel. Click Scan Selection again to recalculate statistics.
3 Evaluate amplitude on the following tabs:
• The General tab displays numerical statistics that indicate dynamic range, identify clipped samples, and note any
DC offset.