18
Digital Ground Resistance Tester Model 3640 and 4610
20
10
0
0
-5
-15
68
50
32 (water)
32 (ice)
23
14
7,200
9,900
13,800
30,000
79,000
330,000
Resistivity
Ω-cm
Temperature
°C °F
Table 3
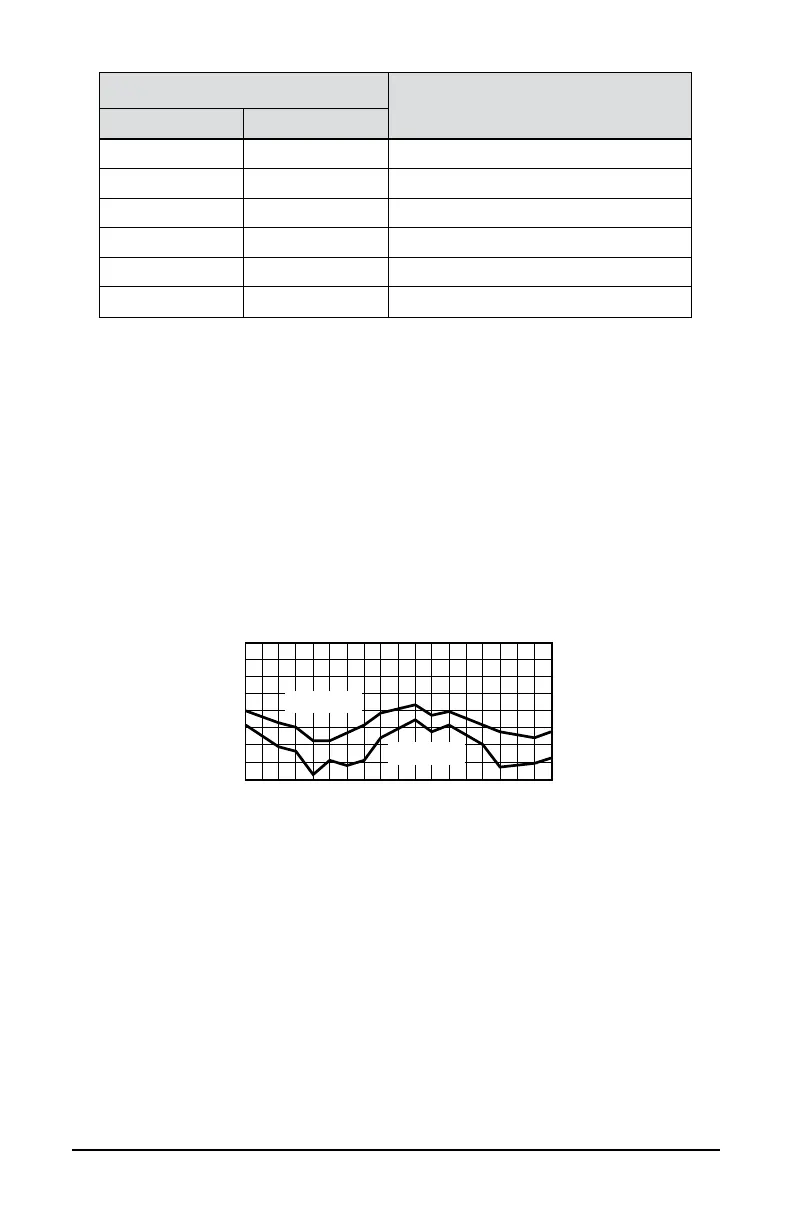
Because soilresistivity directly relates to moisture content andtemper-
ature, it is reasonable to assume that the resistance of any grounding
systemwillvarythroughoutthedifferentseasonsoftheyear.Suchvaria-
tionsareshowninFigure6below.
Since both temperature and moisture content become more stable at
greaterdistancesbelowthesurfaceoftheearth,itfollowsthatagrounding
system(tobemosteffectiveatalltimes)shouldbeconstructedwiththe
groundroddrivendownaconsiderabledistancebelowthesurfaceofthe
earth.Bestresultsareobtainedifthegroundrodreachesthewatertable.
0
20
40
60
80
Jan.
Mar.
May
July
Sept.
Nov.
Jan.
Mar.
May
July
Curve 1
Curve 2
Figure 6
Seasonal variation of earth resistance with an electrode of 3/4" pipe in
rather stony clay soil. Depth of electrode in earth is 3 ft for Curve 1, and
10 ft for Curve 2.
Insomelocations,theresistivityoftheearthissohighthatlow-resistance
groundingcanbeobtainedonlyatconsiderableexpenseandwithanelab-
orategroundingsystem.
Insuch situations,itmaybeeconomicaltouseagroundrodsystemof