Average water temperature [°C] 5 10 15 20 30 40 50
Correction factor
1,22 1,10 1,08 1,06 1,04 1,02 1,00
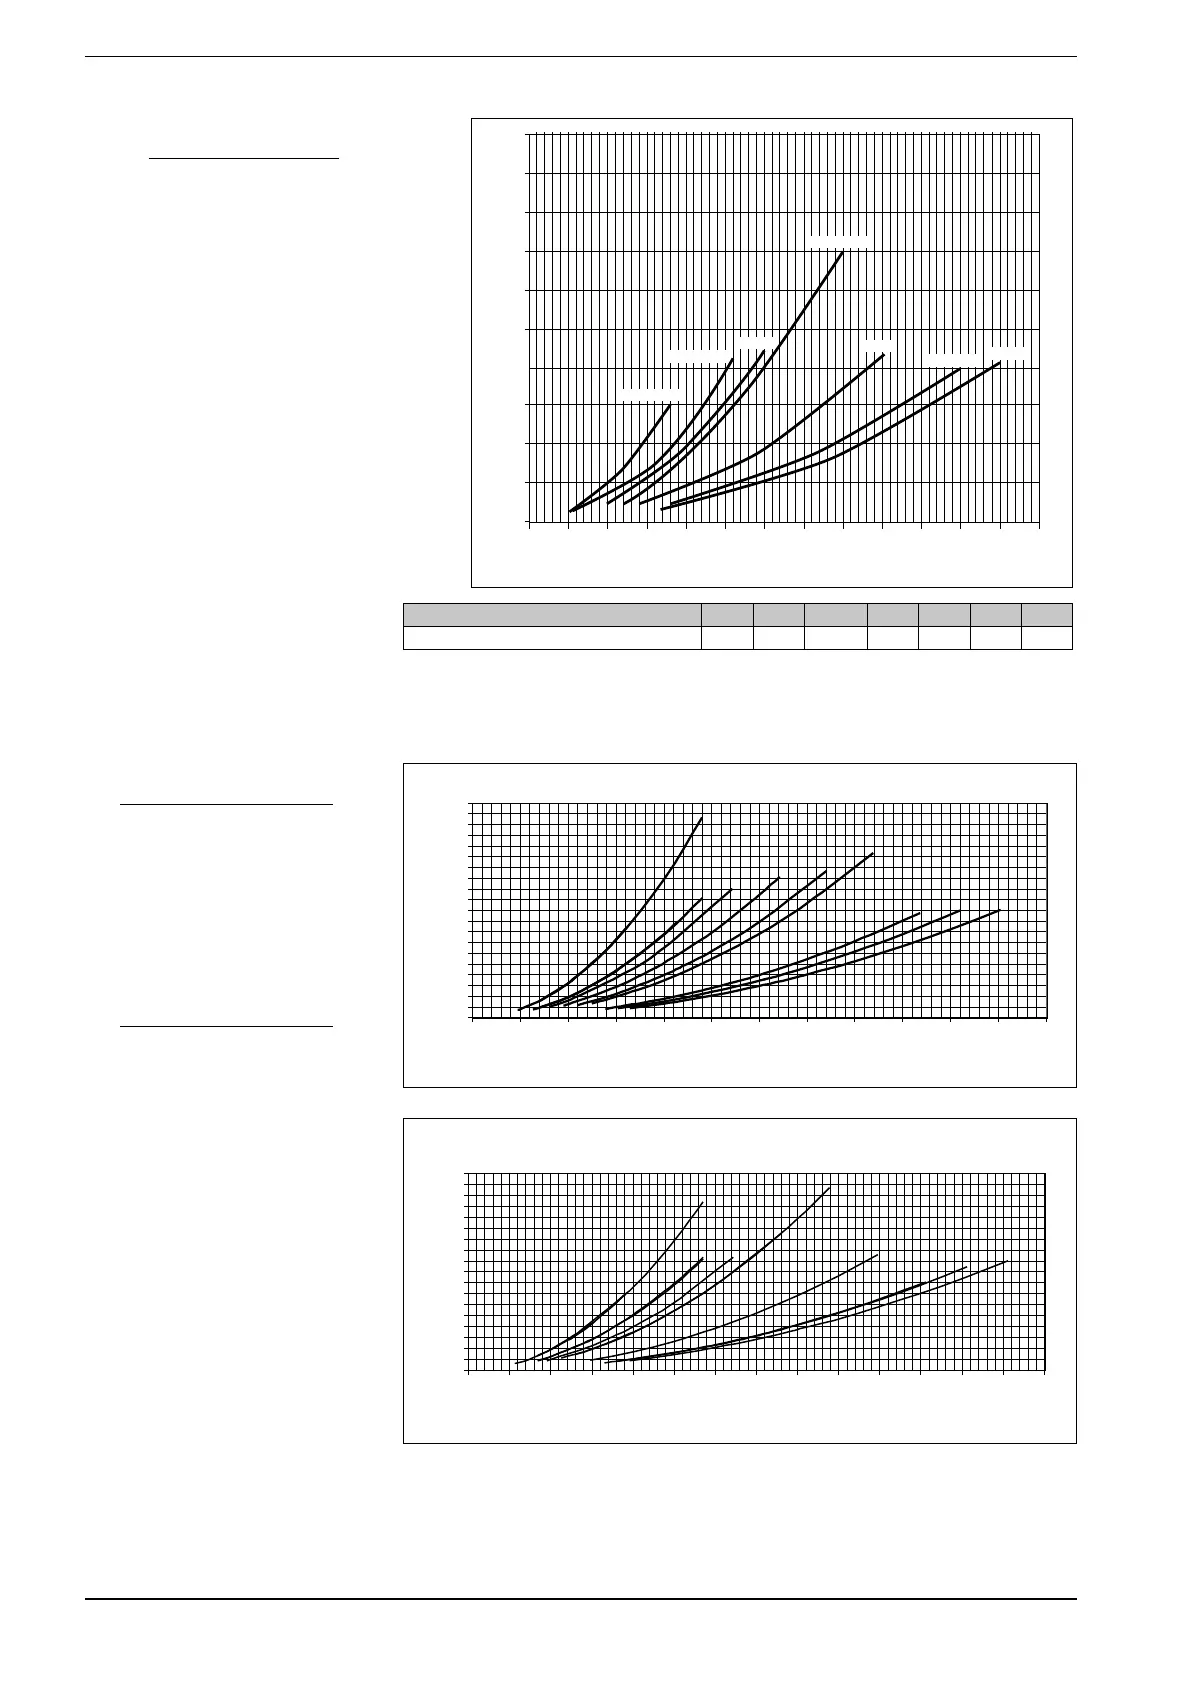
8.17. PRESSURE DROPS TOTAL
RECOVERY
The pressure drops in the charts refer
to an average water temperature of
50 °C. The table (8.17.1) shows the cor-
rections to apply to the pressure drops
with a variation in average water
temperature.
0600-0650
0700
0500-0550
0900
0750-0800
1000-1250
1400
0
100
200
0 10000 20000 30000 40000 50000 60000 70000 80000 90000 100000 110000 120000 130000
Water flow l/h
Pressure drop (kPa)
Tab 8.17.1
9. TOTAL PRESSURE
DROPS
9.1. EVAPORATOR IN COOLING
OPERATION
The diagram pressure drops are
related to an average water
temperature of 10 °C. The follow-
ing table shows the correction to
apply to the pressure drops when
the average water temperature
varies
9.2. CONDENSER IN COOLING
OPERATION
The pressure drops in the dia-
gram refer to the average
water temperature of 30 °C:
the following table shows the
correction to be applied to
the pressure drops when the
average water temperature
varies.
Pressure drops (kPa)
Water flow rate l/h
CONDENSER PRESSURE DROPS VERSION °, H,
EVAPORATOR VERSION H
0
10
20
30
40
50
60
70
80
90
100
110
120
130
140
150
160
170
180
0 10000 20000 30000 40000 50000 60000 70000 80000 90000 100000 110000 120000 130000 140000
0600-0650
700
0750-0800
900
1000-1250
1400
0500-0550
Pressure drops (kPa)
Water flow rate l/h
EVAPORATOR PRESSURE DROPS VERSION °
0
10
20
30
40
50
60
70
80
90
100
110
120
130
140
150
160
170
180
190
200
0 10000 20000 30000 40000 50000 60000 70000 80000 90000 100000 110000 120000
750
900
1000
1250
1400
800
700
500550
650600
24
INXWPY. 1004. 4438805_00
 Loading...