4-30
Printing, Plotting, and Saving Measurement Results
Plotting Multiple Measurements Per Page from Disk
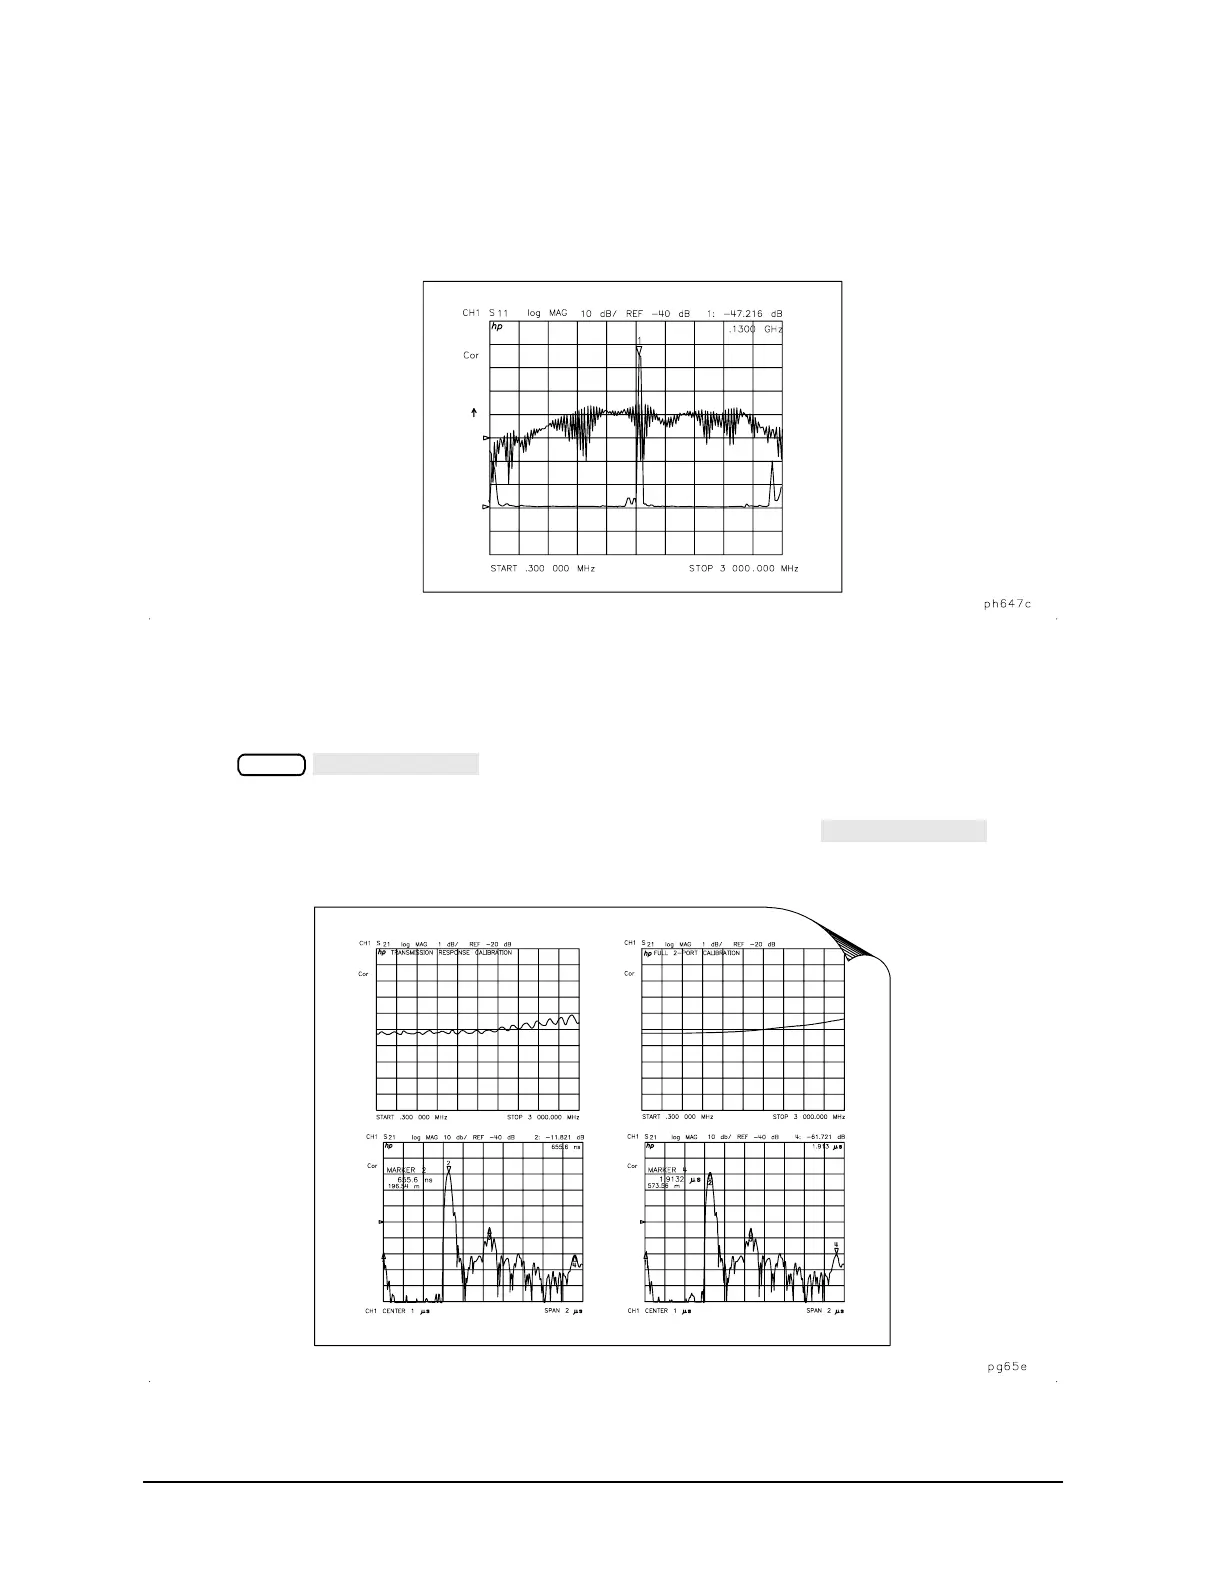
Figure 4-10 shows plots for both the frequency and time domain responses of the same
device.
Figure 4-10 Plotting Two Files on the Same Page
To Plot Measurements in Page Quadrants
1. Define the plot, as explained in "Defining a Plot Function" on page 4-15.
2. Press .
3. Choose the quadrant where you want your displayed measurement to appear on the
hardcopy. The selected quadrant appears in the brackets under .
Figure 4-11 Plot Quadrants
Copy

 Loading...
