7-26
Operating Concepts
Analyzer Display Formats
Smith Chart Format
The softkey displays a Smith chart format. Refer to Figure 7-9. This is
used in reflection measurements to provide a readout of the data in terms of impedance.
The intersecting dotted lines on the Smith chart represent constant resistance and
constant reactance values, normalized to the characteristic impedance, Z
0
, of the system.
Reactance values in the upper half of the Smith chart circle are positive (inductive)
reactance, and those in the lower half of the circle are negative (capacitive) reactance. The
default marker readout is in ohms (Ω) to measure resistance and reactance (R+jX).
Additional marker types are available in the Smith marker menu.
The Smith chart is most easily understood with a full scale value of 1.0. If the scale per
division is less than 0.2, the format switches automatically to polar.
If the characteristic impedance of the system is not 50 ohms, modify the impedance value
recognized by the analyzer by pressing (the impedance value) .
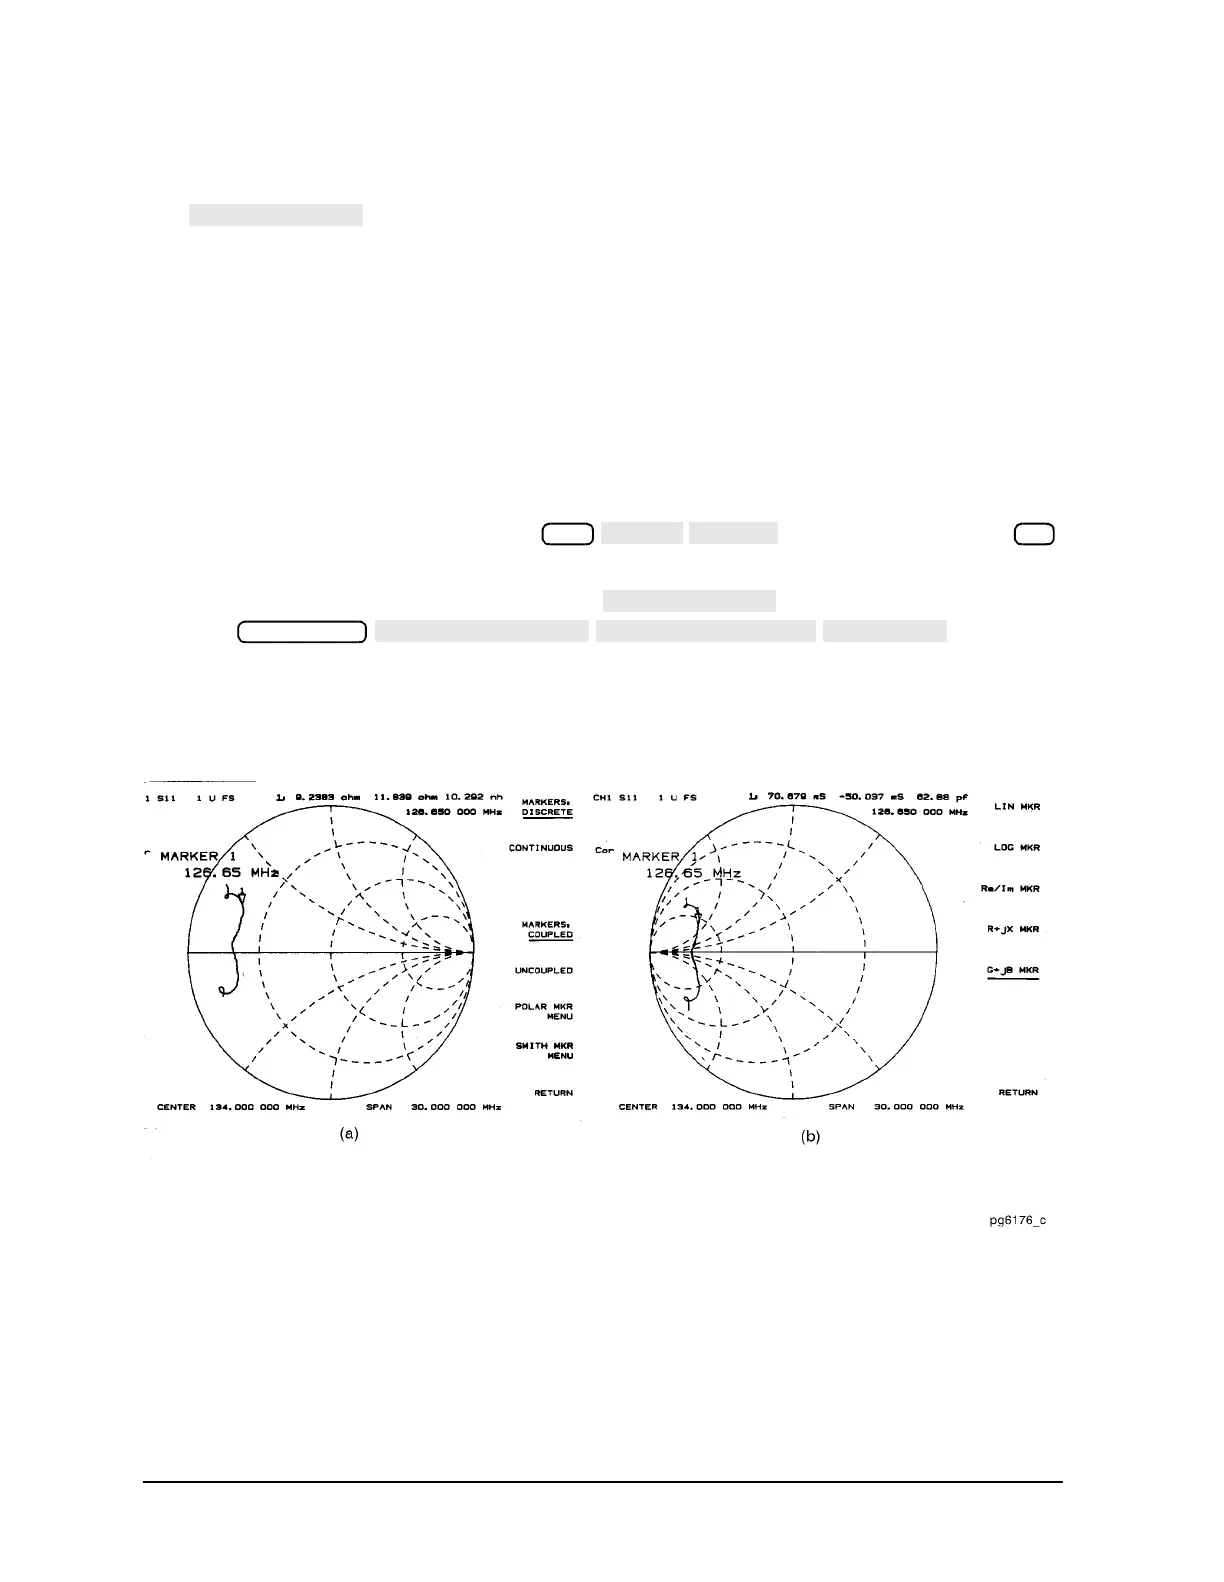
An inverted Smith chart format for admittance measurements is also available. This is
shown in Figure 7-9. Access this by selecting in the format menu, and
pressing . The
Smith chart is inverted and marker values are read out in siemens (S) to measure
conductance and susceptance (G+jB).
Figure 7-9 Standard and Inverse Smith Chart Formats
x1
Marker Fctn