32
www.agilent.com/find/esg
External BBG reference
The ESG baseband generator uses an internal reference clock as its time base.
Alternatively, an external reference clock can be used as the time base by selecting
External BBG reference. If an external reference is used, it should be connected to the
ESG prior to downloading waveform and instrument settings.
Invert marker polarity
Selecting invert marker polarity changes the polarity of the ESG event 1 and event 2
markers from positive to negative. The event 1 marker is used to generate the symbol
clock and the event 2 marker is used to generate the payload data gate. Both signals
are TTL level. Access to these signals is provided on the rear panel of the ESG. The
default setting, positive, is correct if the marker signals are directly routed to the ESG
internal BER analyzer clock and gate in ports.
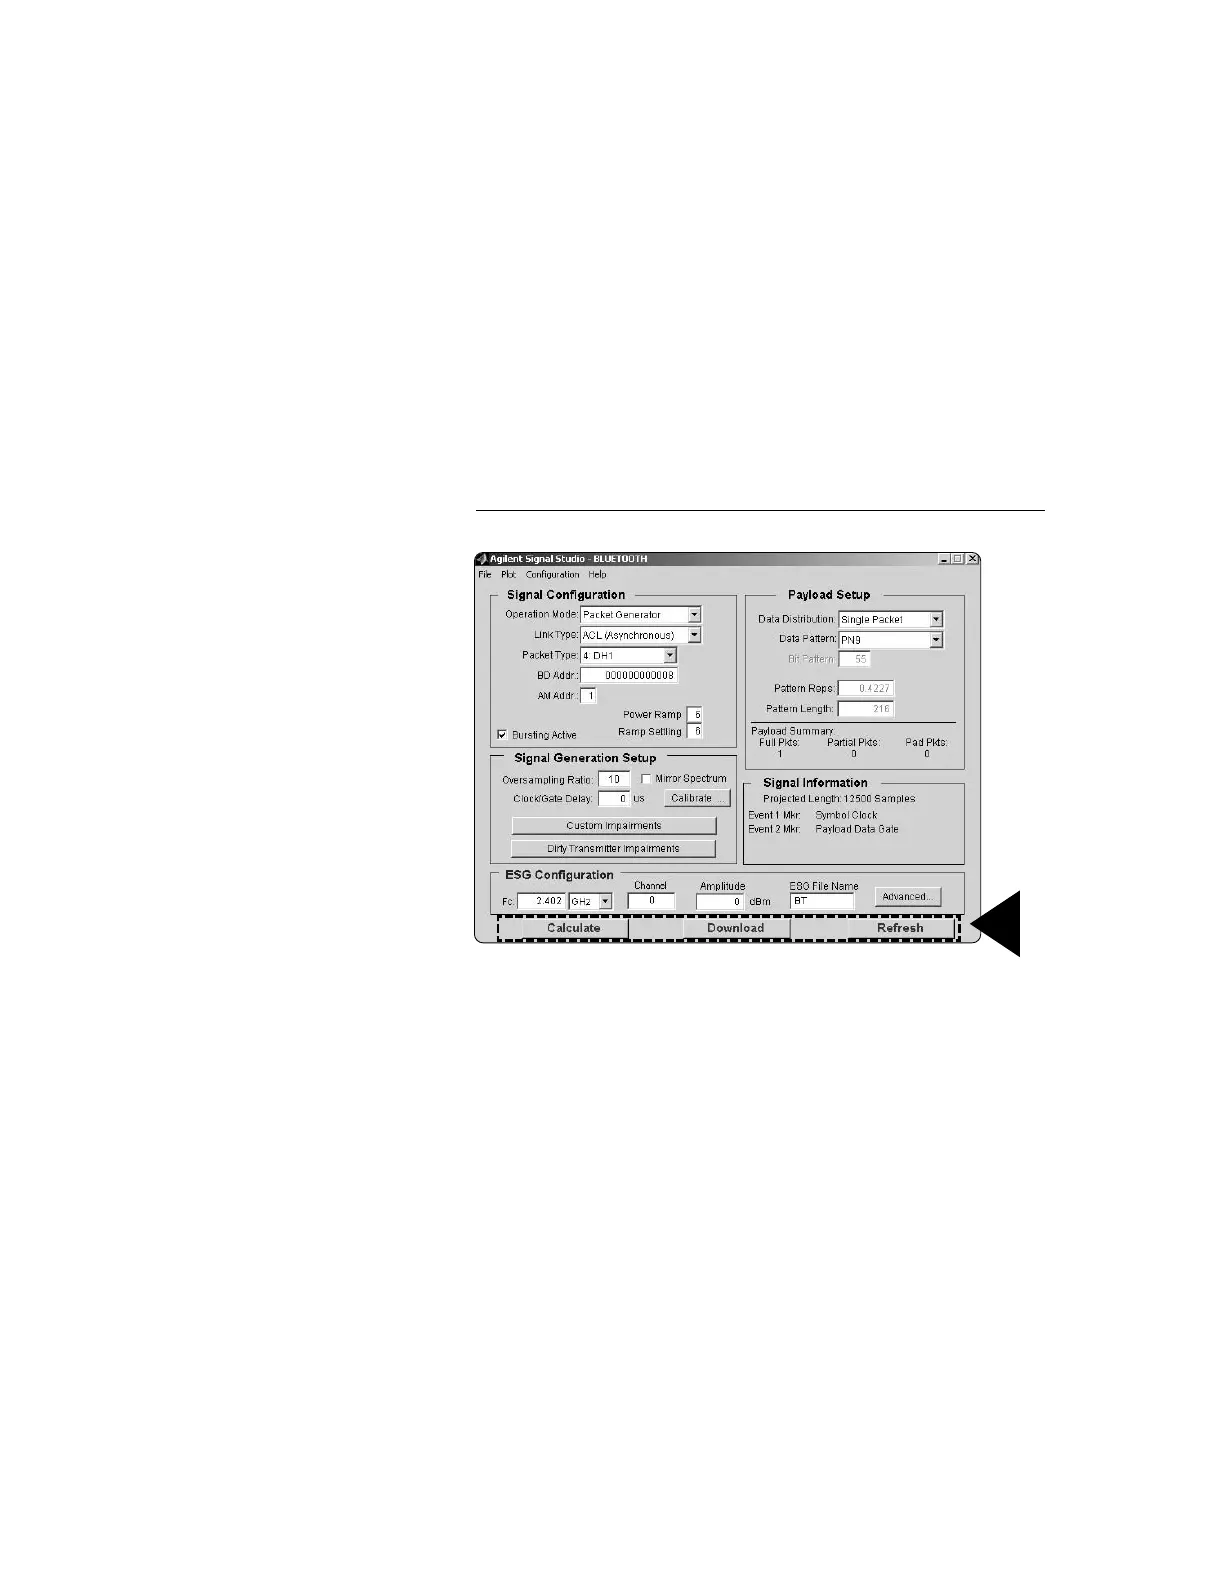
Step 4 Calculate and download
Figure 36. Calculate, download, and refresh functions.
Once the waveform and ESG settings have been configured, the final step is to calculate
the waveform and download it to the instrument, Figure 36.
Calculating waveforms
To initiate waveform calculation, select the Calculate button. The software will generate
an I/Q waveform file in accordance with the current signal configuration. Waveform
calculation typically takes only a few seconds.
Plotting waveforms
After the I/Q waveform has been calculated, the Signal Studio software can generate
a plot of the baseband spectrum, I/Q waveforms, and CCDF curve. To plot the spectrum,
choose Plot > Spectrum from the menu keys at the top of the main user interface window,
Figure 36. The plot can be magnified using the zoom feature in the Tools pull-down menu
at the top of the plot, Figure 37. Simply select the zoom feature and use the mouse pointer
to select the section of the plot to be affected. Plots of the I/Q waveforms and CCDF
curve can be generated in a similar manner.
Creating Signals
 Loading...