SP2+ Introduction Manual
- 13 -
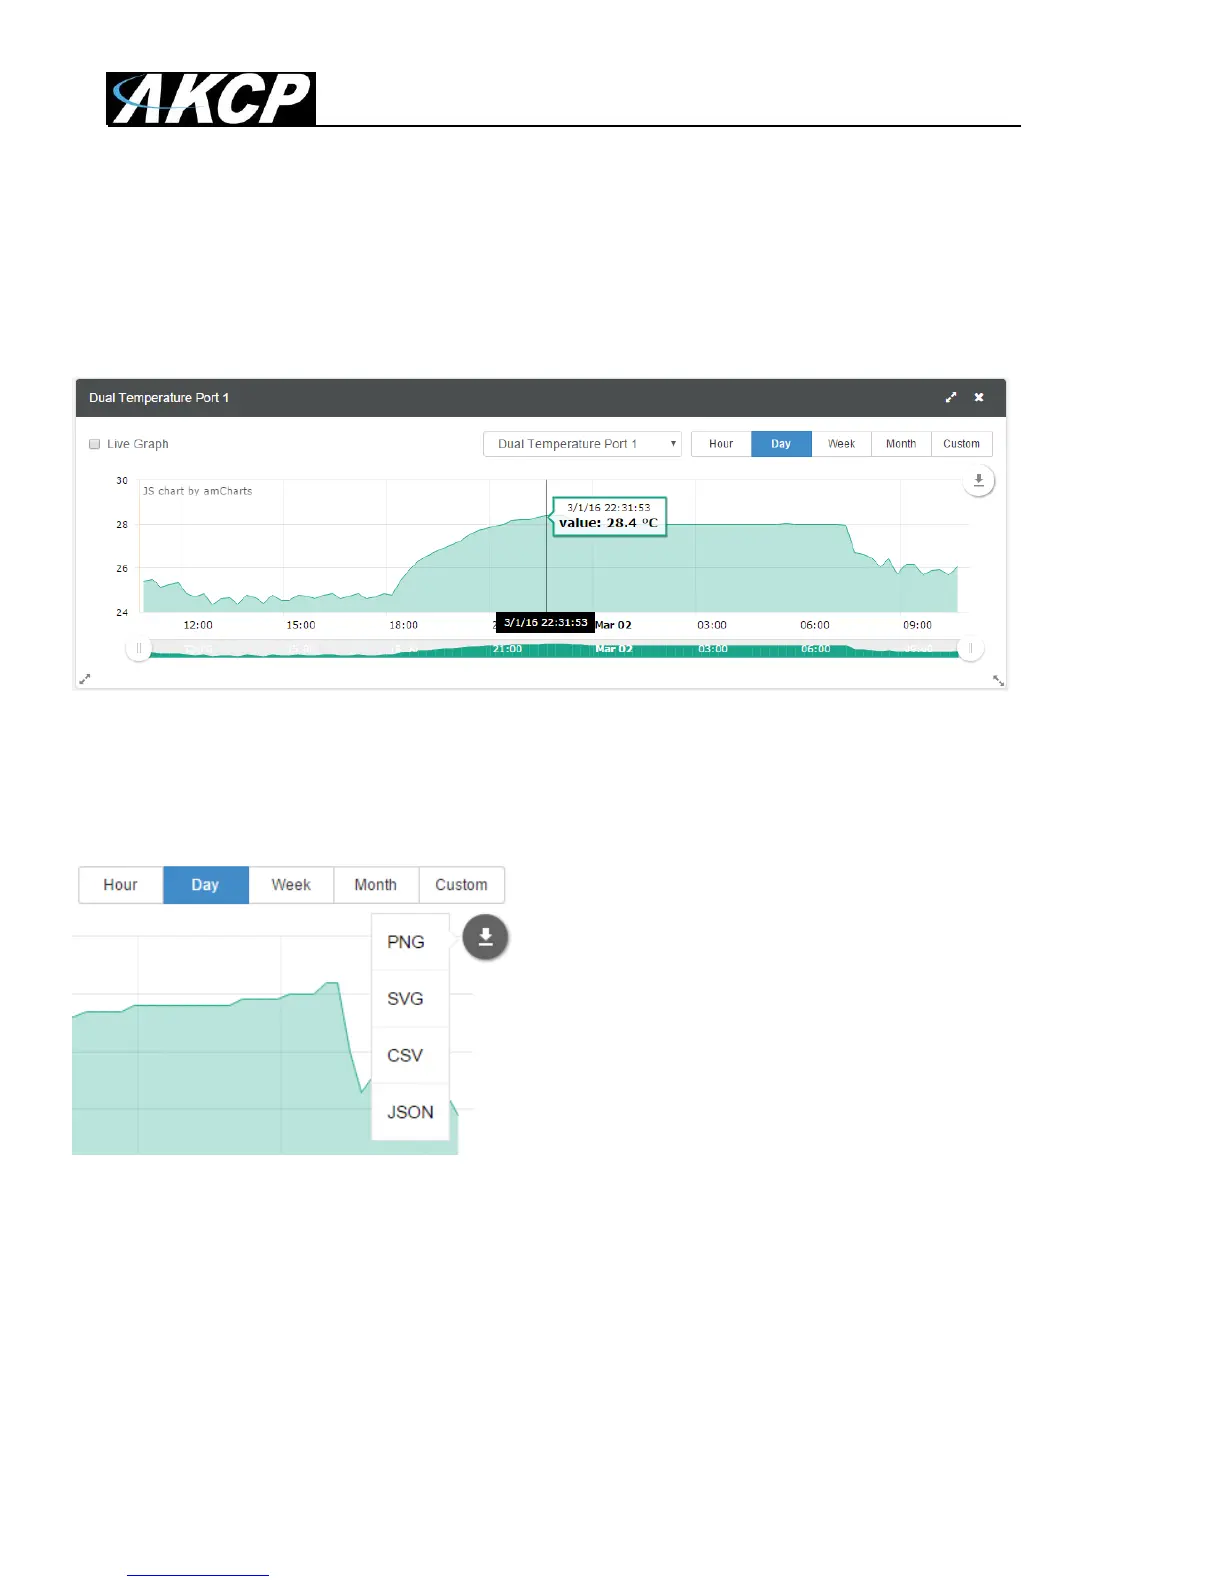
Graph feature
After you’ve enabled the data collection for a sensor, you can choose to display specific time intervals
of the stored data: hourly/daily/weekly/monthly and custom display interval.
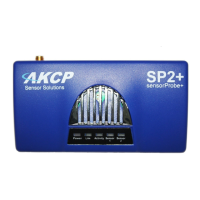
You can also export the recorded data in multiple formats.
In this example picture, we’ve chosen to display the temperature sensor’s daily maximum.
You could also resize the graph window (including full screen) and move the scale to display more or
less data.
You can choose to export the graph data in selected formats by clicking on the icon on the right.
The file will be downloaded automatically and assigned a file name that will contain the sensor’s
name, IP address of the unit, and the date and time.