www.analog.com
Analog Devices
│
13
MAX30001 Evaluation System Evaluates: MAX30001
MAX30002
Plots Tab
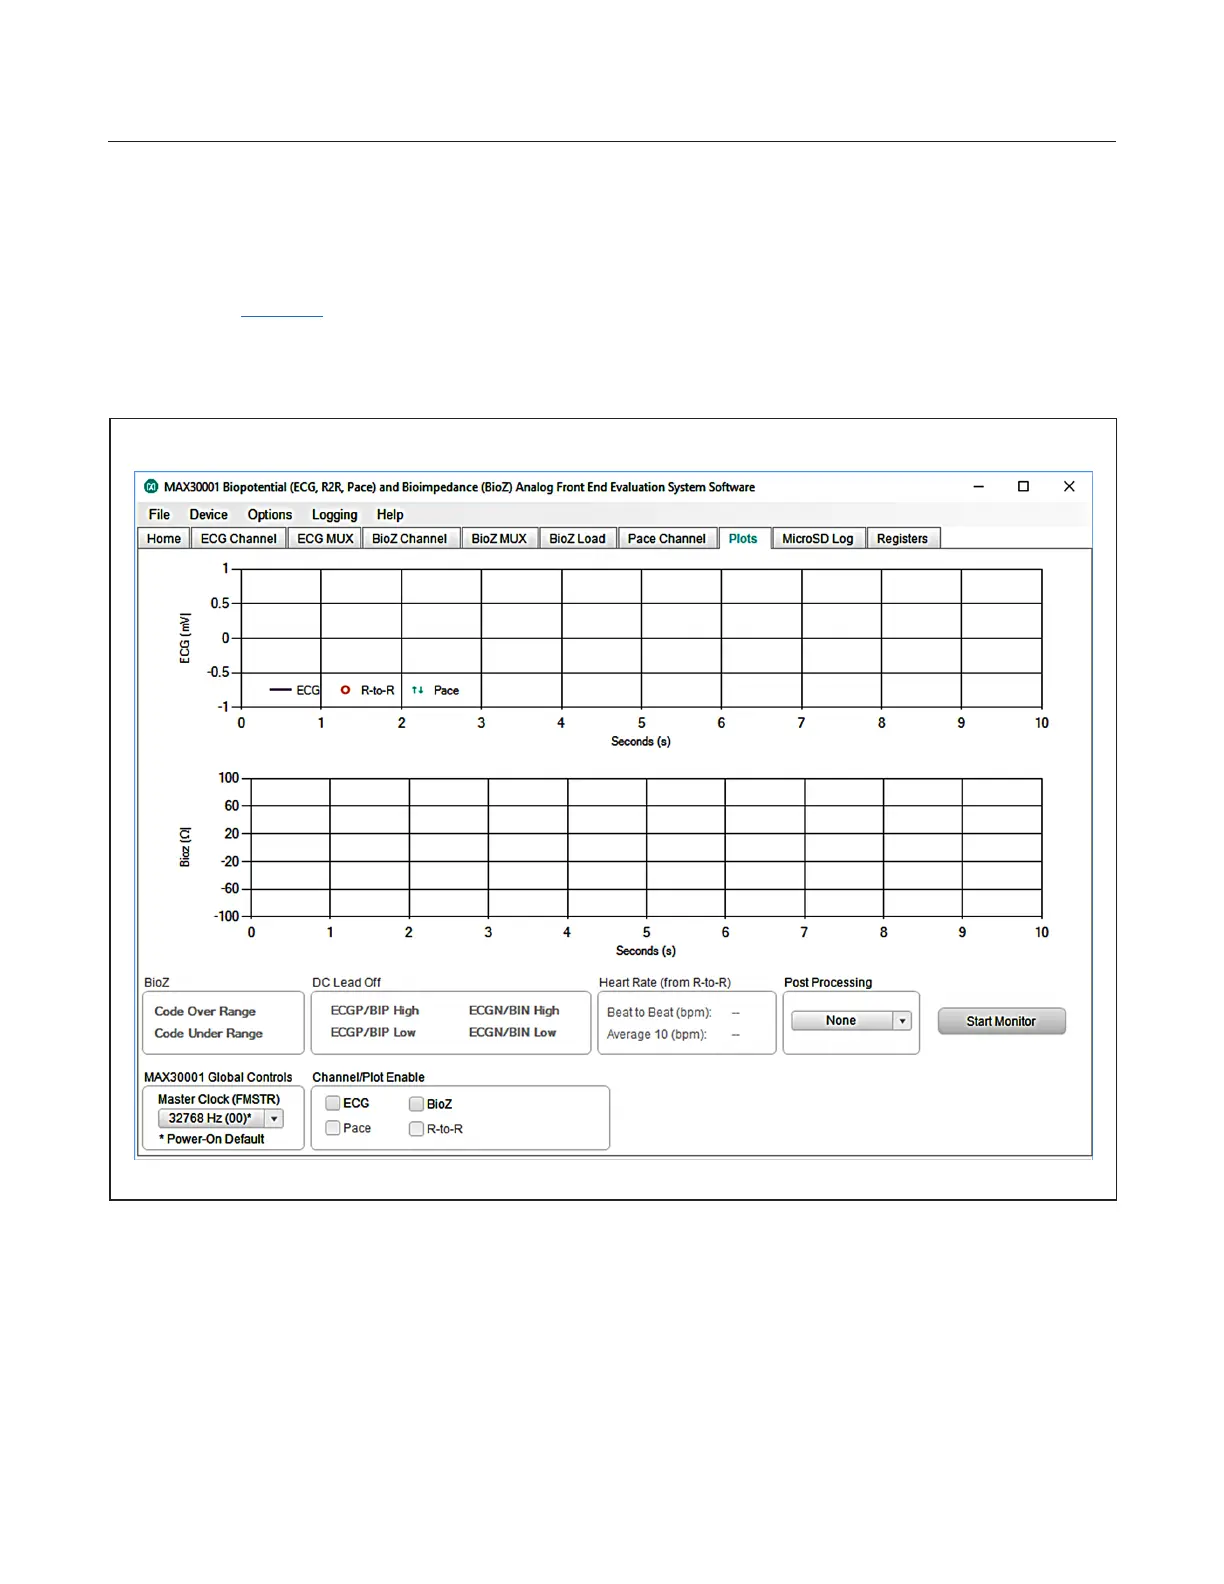
The Plots tab (Figure 12) enables real time monitoring of ECG and BioZ waveforms. By default, both ECG and BioZ
plots are visible. Toggling the controls in Channel/Plot Enable changes which of the two plots is displayed. If ECG is
enabled and BioZ is disabled, the plot area will be occupied entirely by the ECG waveform. Likewise, if BioZ is enabled
instead of ECG, the BioZ plot is maximized. When both measurement channels are enabled, the plotting space contains
both ECG and BioZ data.
Figure 12. Plots Tab.
 Loading...