www.analog.com
Analog Devices
│
14
MAX30001 Evaluation System Evaluates: MAX30001
MAX30002
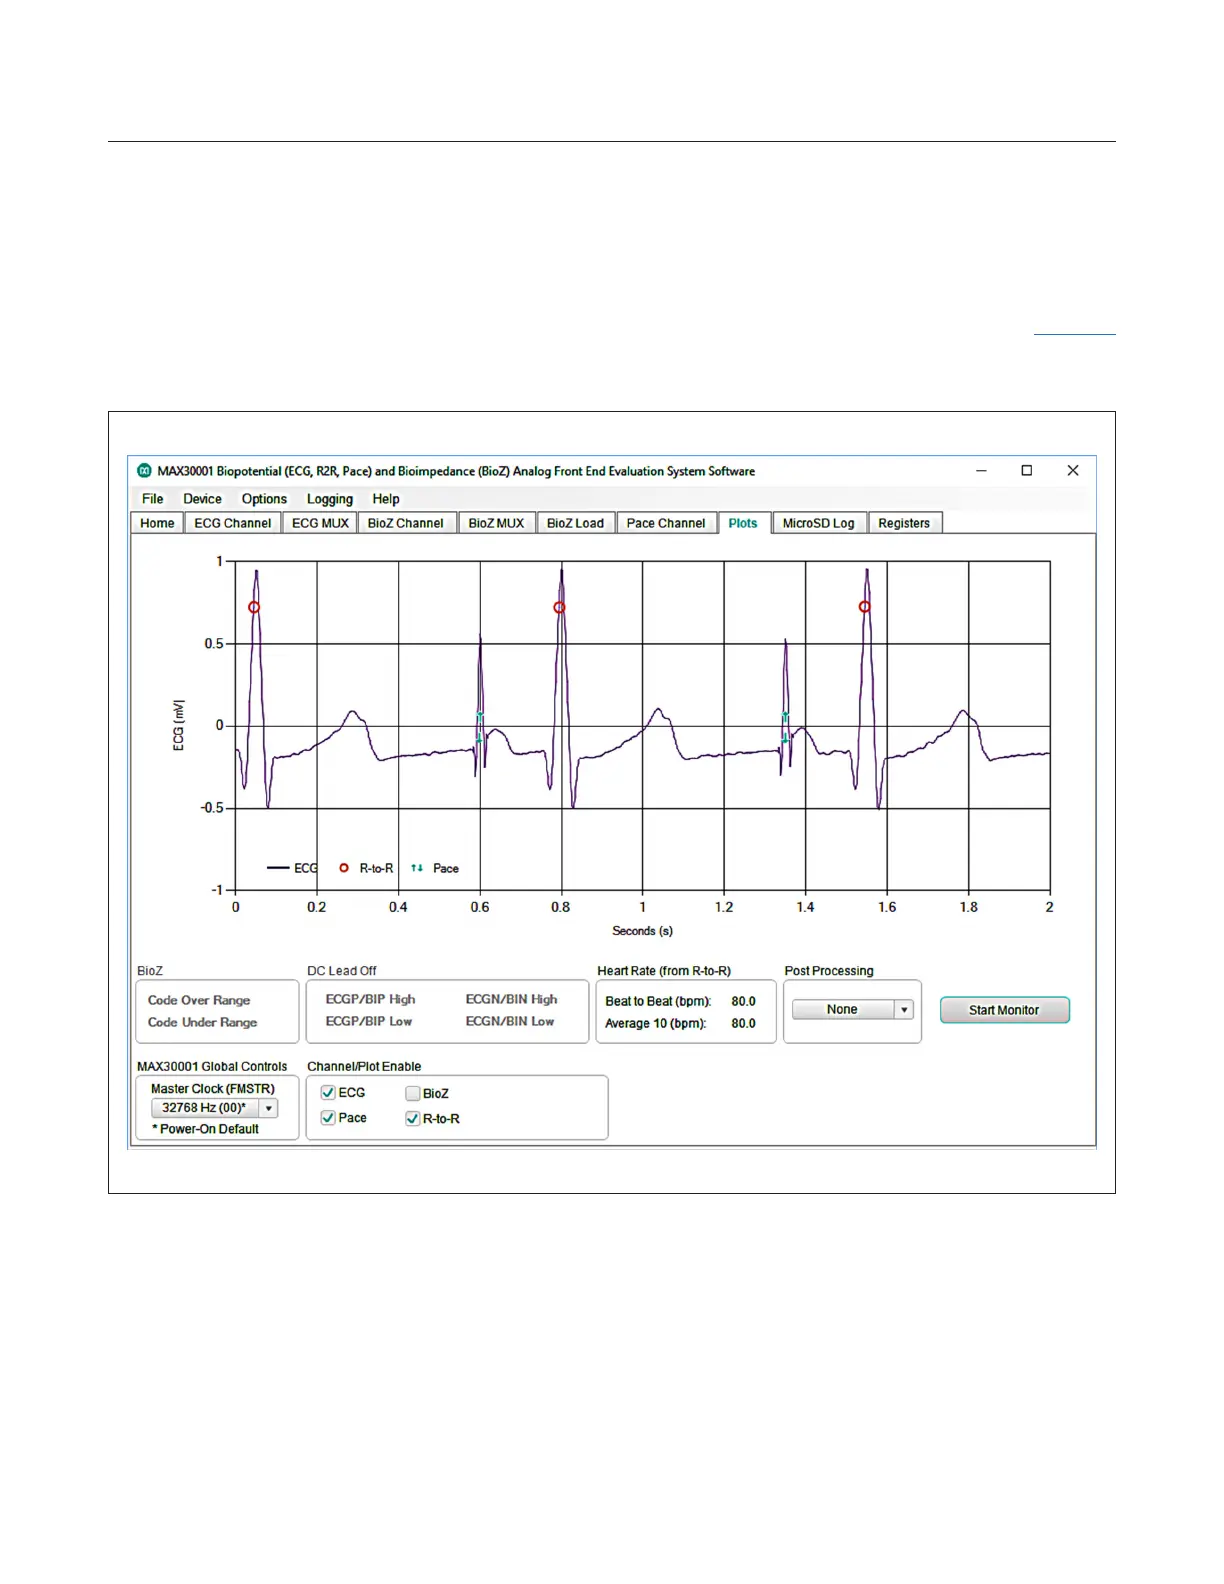
R-to-R and Pace data is shown in the ECG plot. R-to-R peak detection is indicated by a red circle at the peaks of the
R waves. Pace data appears as teal arrows on the rising and falling slopes of the pace signal. Heart rate information
gathered from R-to-R detection can be found in the Heart Rate (from R-to-R) box below the plotting area. Figure 13
illustrates an ECG waveform with R-to-R and pace detection enabled. The ECG sample rate is 512sps and the BioZ
current generator frequency is 80kHz.
Figure 13. An ECG Waveform with R-to-R and Pace Detection Enabled.
 Loading...