1
1 - 63
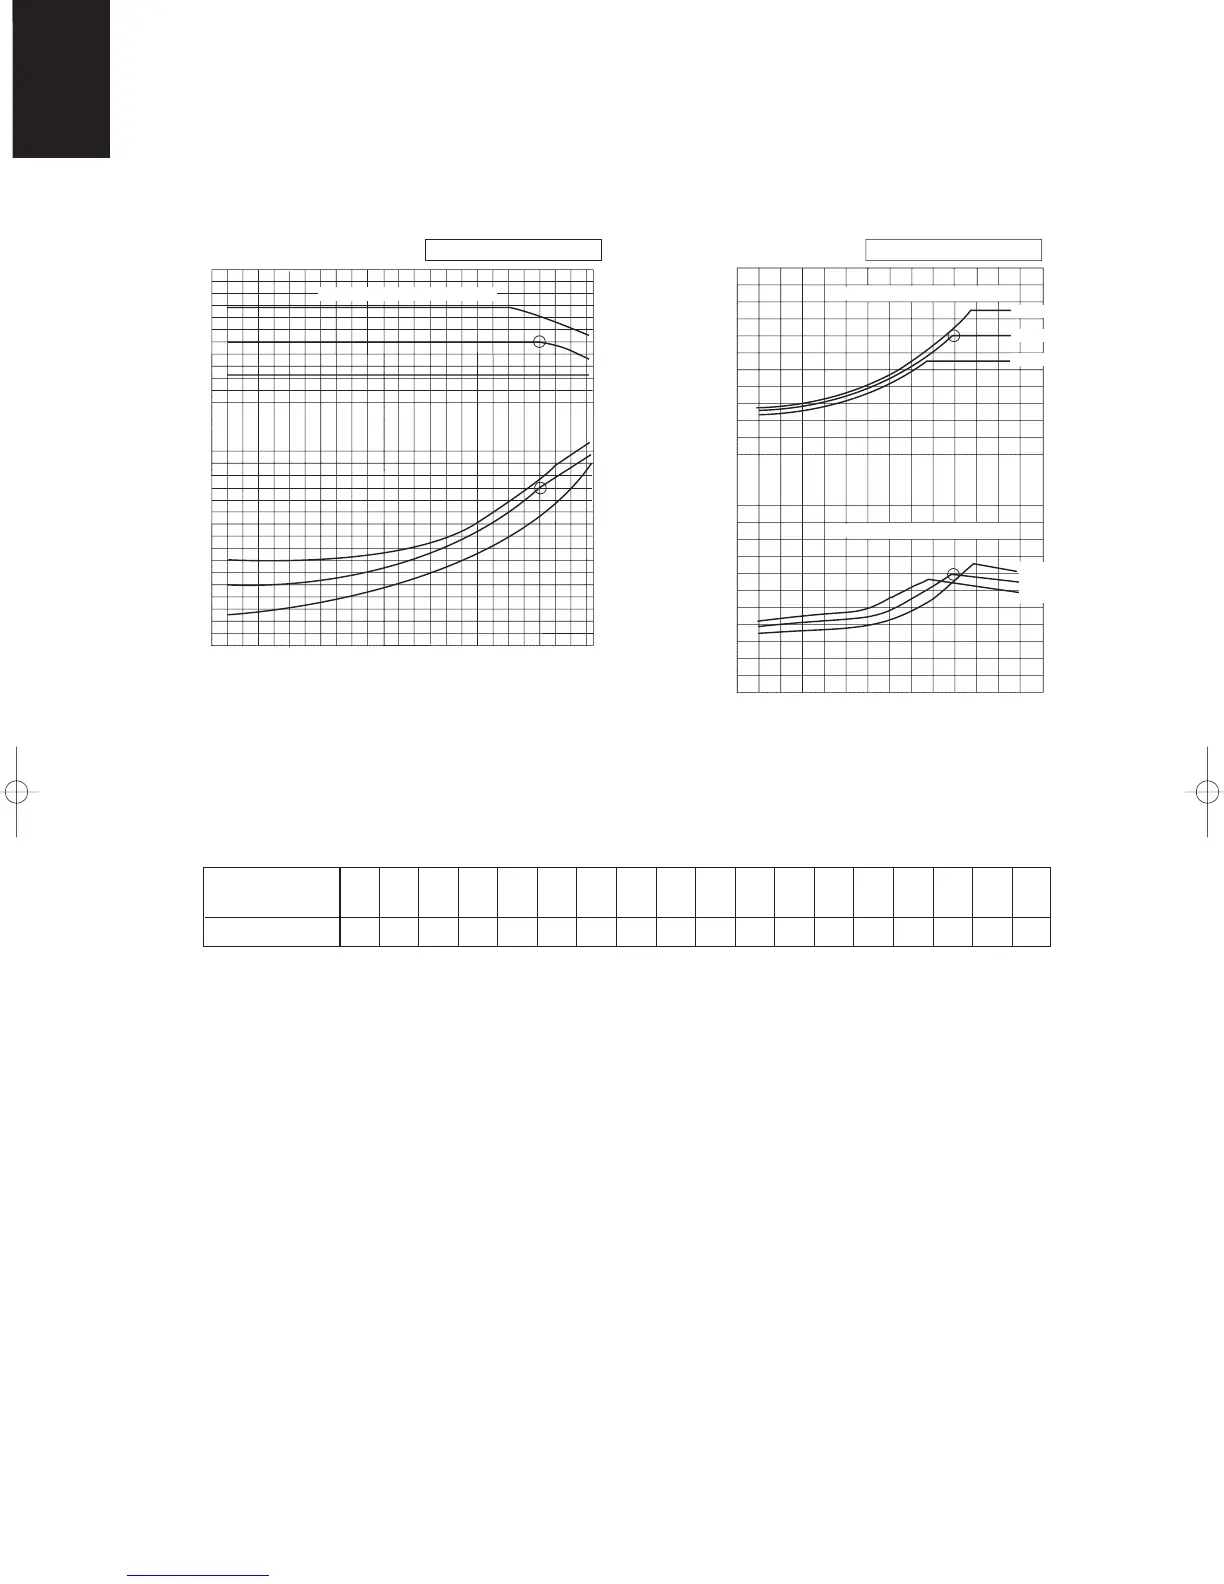
1-7. Capacity Correction Graph According to Temperature Condition
AES71/100/125PIH
0.950.92 1.0
45 6
0.870.880.890.910.940.950.960.960.970.97 0.89 0.910.87 0.87 0.88
120
120
100
80
60
40
100
80
60
40
–15 –10 10 15–5 0 5
For 50 Hz and 60 HzFor 50 Hz and 60 Hz
Capacity coefficient (%)Input coefficient (%)
Cooling capacity ratio (maximum capacity) Heating capacity ratio (maximum capacity)
Outdoor air intake temp (°C DB)
Outdoor air intake temp (°C WB)
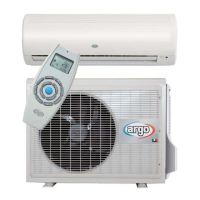
Outdoor unit heating capacity correction coefficient during of frosting/defrosting
(RH approximately 85%)
–15 –10 –9 –8 –7 –6 –5 –4 –3 –2 –1 0 1 2 3
Indoor air intake temp (°C DB)
Indoor air intake temp (°C DB)
Outdoor intake air
temperature
°C WB (85% RH)
Correction coefficient
80
100
110
80
90
100
110
120
90
70
60
50
40
–15 –10 10 15–5 0 5 20 25 4330 35 40
To calculate the heating capacity with consideration for frosting/defrosting operation, multiply the heating
capacity found from the capacity graph by the correction coefficient from the table above.
Indoor air intake temp (°C DB)
Capacity coefficient (%)Input coefficient (%)
22WB
19WB
16WB
16WB
22WB
19WB
16°C
20°C
24°C
16°C
20°C
24°C
04-309 Sanyo-1_p96-127 12/7/04 10:42 AM Page 108