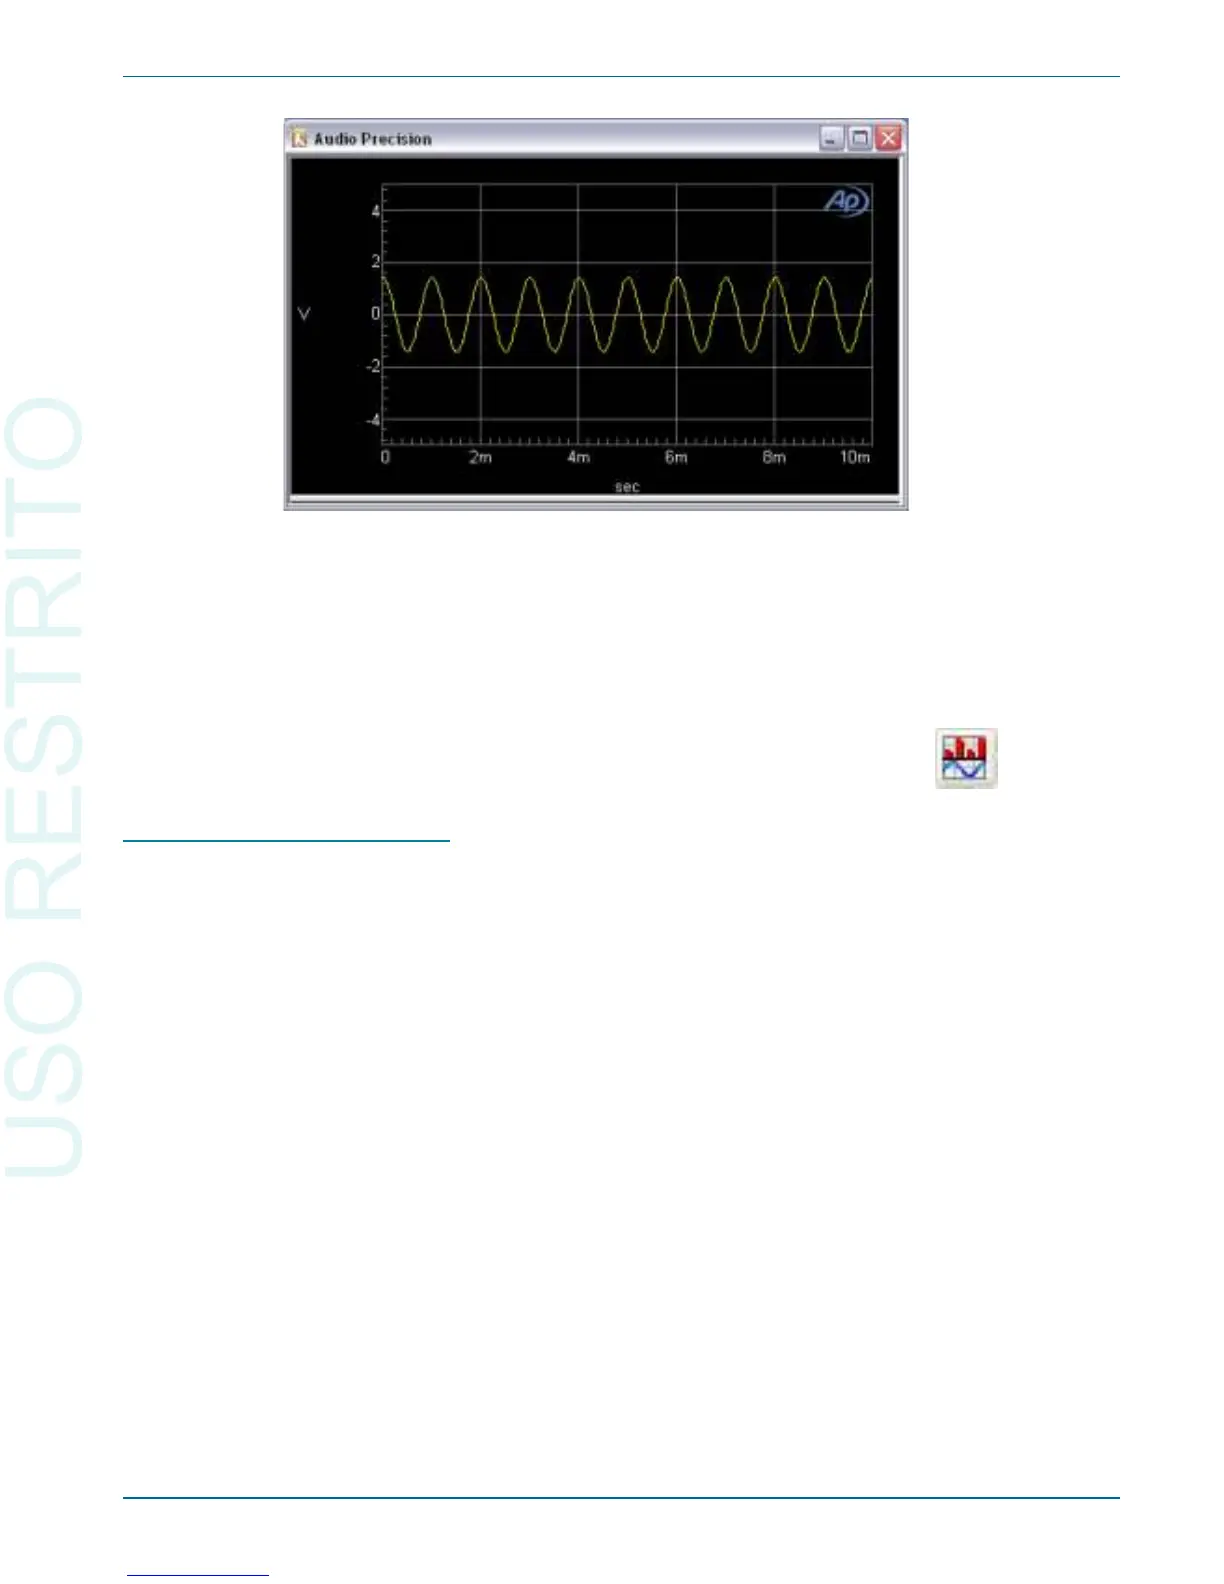
The dis play shows a sine wave with a pe riod of 1 ms (cor re spond ing to a
fre quency of 1 kHz) and a peak ex cur sion of 1.414 V (cor re spond ing to an
am pli tude of 1 Vrms). The ef fect of the dis tor tion on the wave form is not vis i -
ble in the time do main.
You can switch be tween the time do main and fre quency do main dis plays at
any time by click ing the Sweep Spec trum/Wave form but ton.
Fine-Tuning the Display
There are sev eral ways to ad just the graph dis play to more closely ex am ine
fea tures of the ac quired wave form:
§
Zoom
On the graph, draw a box by hold ing down the left mouse but ton and
mov ing the mouse. When you re lease the but ton, the soft ware zooms the
se lected area to the full graph size.
§
Zoomout
Af ter zoom ing, click the right mouse but ton on the graph. From this
right-click menu, choose Zoomout. The graph zooms out to the pre-
zoom size.
§
Op ti mize
From the right-click menu, choose Op ti mize Left Only. The ver ti cal
axis changes to best fit the data in the graph.
For more de tails, see Chap ter 18 of the 2700 Se ries User’s Man ual.
The FFT Spectrum Analyzer Chapter 5: Quick Guides
Getting Started with Your 2700 Series Instrument 49
Figure 30. Typical default FFT stereo time domain graph.
 Loading...