T M
Document NAE1018021 • 09.2014 • © Bender Inc. • Page 1/1 • Side 2/2Bender Inc. • USA: 800.356.4266 / 610.383.9200 / info@bender.org • Canada: 800.243.2438 / 905.602.9990 / info@bender-ca.com • www.bender.org
iso685
Installation Bulletin / Reference Guide
Menu structure flow chart
Figure 5 shows the structure of the menu built into the iso685. The menu is used for viewing
alarms, viewing the status of the system, and making any necessary settings changes.
Use the supplied gray boxes to take note of applied settings for future reference. For detailed
descriptions of each menu option, refer to the complete iso685 user manual.
Menu or settings option
Settings option essential for proper operation
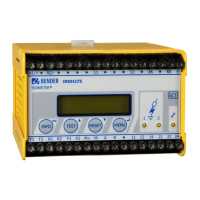
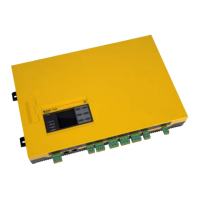
Displays and controls
1. “^” button: Up button, increase value in
menu
2. “RESET” button: Resets device in
latched mode; “<” button: Back button,
select parameter
3. “DATA” button: Displays data values; “v”
button: Down button, decrease value in
menu
4. “MENU” button: Enters main menu;
“ESC” button: Return to previous menu
level
5. “TEST” button: Activates self-test; “>”
button: Right / forward button, select
parameter
6. “INFO” button: Displays system infor-
mation; “OK” button: Confirms values
7. LED “ON”: Power applied to the device
8. Alarm LED indicators: SERVICE, 1, 2
9. Backlit LCD display
Dimensions
Dimensions in inches (mm).
4.25“ (108)
4.3“ (110)
3.7“ (93)
1. Alarm settings 1. Insulation alarm
3. Memory
1. Alarm 1
2. Alarm 2
2. Profile
3. System type
4. Coupling
5. Device
6. t(start)
7. Coupler monitor.
8. Inputs
1/2/3. Digital 1/2/3
1. Mode
2. t(on)
3. t(off)
4. Function
9. Outputs
1/2. Relay 1/2
1. TEST
2. Relay mode
3/4/5. Function 1/2/3
3/4. Digital 1/2
1. TEST
2. Relay mode
3/4/5. Function 1/2/3
5. Buzzer
1. TEST
2/3/4. Function 1/2/3
6. Analog
1. Mode
2. Scale center
3. TEST
4. Function
2. Data meas. value
3. Control 1. TEST
2. RESET
3. Start initial
1 kΩ - 10 MΩ
active high / low
1 kΩ - 10 MΩ
on / off
See reverse page
AC / 3AC / DC
active / inactive
0 - 120 s
on / off
100 ms - 300 s
100 ms - 300 s
test / reset / standby
none / coupler
N/O / N/C
See reverse page
active / passive
See reverse page
See reverse page
0(4)-20 mA, 0-10V
linear / 28kΩ / 120kΩ
resistance / DC shift
4. History
5. Device settings
1. Language
2. Clock
3. Interface 1. BMS
1. Address
1 - 150
2. Ethernet
4. Display
1. Brightness
5. Password
6. Commissioning
7. Service
6. Info
Initial setup (continued)
Alarm value
Alarm values for insulation resistance vary by system due to the type of connected loads and
general system conditions. Adjust the alarm values to appropriate levels based on the system
that is connected to. As a general rule for setting initial alarms, values of 100 Ω/V for the pre-
warning and 50 Ω/V are recommended. These may be adjusted afterwards as prevailing sys-
tem comditions warrant.
Outputs
Two SPDT contacts are available for alarm outputs. The relays’ energizing behavior is described
in the table “Device relay conditions.” Under the FUNCTION menu option for each relay, the
relay can be set to trip on individually assigned alarms. Each relay and digital output can trigger
on the following:
• Insulation resistance fault prewarning alarm
• Insulation resistance fault main alarm
• Connection error
• DC- alarm (when a sucient DC fault is detected on the negative line)
• DC+ alarm (when a sucient DC fault is detected on the positive line)
• Symmetrical alarm (when DC fault(s) are detected with no signicant pull on either line)
• Internal device error
• Common alarm (activates on any of the above alarms)
• Device inactive (iso685 is put into standby mode)
Each relay can trigger up to 3 types. The analog output and buzzer can trigger on insulation
resistance fault only. For the relays to trip on any alarm, set the function to “Common alarm.” For
more information, refer to Figure X (device relay conditions), Figure X (menu ow chart), and
the complete iso685 user manual.
1 4
7
8
9
2 5
3 6
Using the iso685
Complete list of features
Consult the iso685 user manual for a complete list of features and instructions for use.
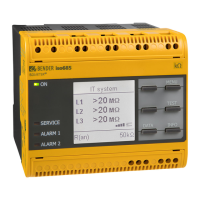
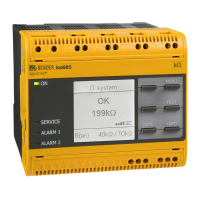
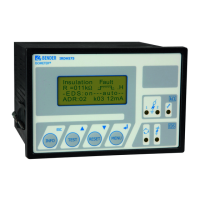
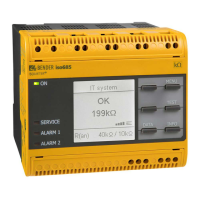
Navigating the device
Use the buttons to the right of the screen to navigate the information screens and the menu. All
button labels are backlit - depending on the current location in the menu, only the usable but-
tons will be backlit. Not all keypad labels may be visible at once. In the example shown below,
the device is in alarm. Only the usable button labels for that screen are lit.
isoGraph - Data trending screen
The iso685 includes the isoGraph features, which provides onboard data trending of the sys-
tem insulation resistance over time. The isoGraph feature is particularly useful for trouble-
shooting ground faults into a time frame. To utilize this feature, access it through
1.0
.100
.010
.001
MΩ
Hour 12:26 12:52
Data-isoGraph 2
1/4
Analog Outputs
Linear option
If a linear analog output is selected, the insulation resistance is 10 kΩ at the high value, and 10
MΩ at the low value, and linerally proportional in between.
Nonlinear output
If the nonlinear output is selected, it is calculated using the following formula:
R
F
- Insulation resistance in kΩ
A
1
- Lower value, analog output (i.e. 0 for 0-20 mA)
A
2
- Upper value, analog output (i.e. 20 for 0-20 mA)
A
3
- measured analog output value
R
SKM
- selected midpoint value (28 / 120 kΩ)
 Loading...