36 37
When assessing your blood pressure, only use the results
that have been recorded without any irregularities in your
pulse.
Consult your doctor if is displayed frequently. Only they
can determine, through an examination, whether there is an
abnormality.
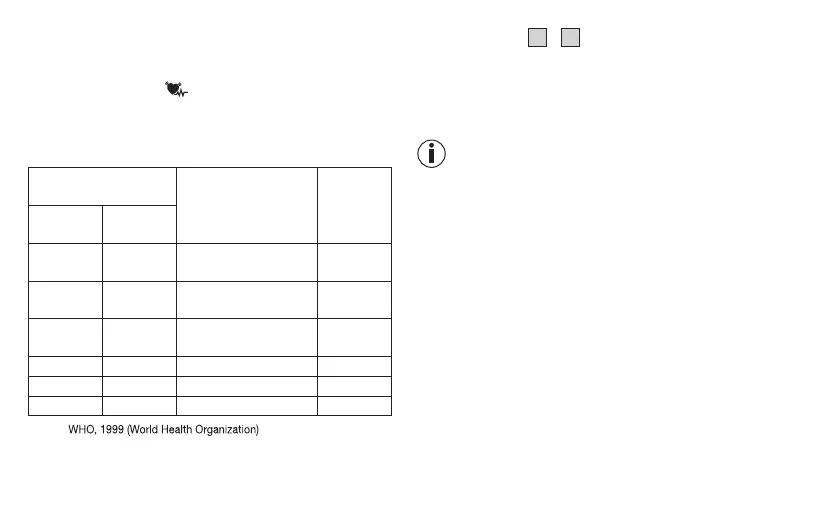
Risk indicator
Measured blood
pressure value range
Classification
Risk
indicator
colour
Systolic
(in mmHg)
Diastolic
(in mmHg)
≥ 180 ≥ 110
Stage 3 high blood
pressure (severe)
Red
160 – 179 100 – 109
Stage 2 high blood
pressure (moderate)
Orange
140 – 159 90 – 99
Stage 1 high blood
pressure (mild)
Yellow
130 – 139 85 – 89 High normal Green
120 – 129 80 – 84 Normal Green
< 120 < 80 Optimal Green
Source:
The risk indicator
8
/
19
indicates which category the re-
corded blood pressure values fall into. If the measured values
are in two dierent categories (e.g. systolic pressure in the
“high normal” range and diastolic pressure in the “normal”
range), the risk indicator always indicates the higher range –
“high normal” in the example described.
Note that these default values are for general guidance
only, as individual blood pressures may vary.
Please note that self-measurement at home usually results
in values lower than those recorded at a doctor’s surgery.
Consult your doctor at regular intervals. Only they are able to
give you personal target values for controlled blood pressure,
particularly if you are receiving medical therapy.
6.5 Displaying and deleting measured
values
User
The results of every successful measurement are saved with
the date and time. If there are more than 60 measurements,
the oldest measurements are deleted.
 Loading...