Getting Started
18 Z33085_2_002
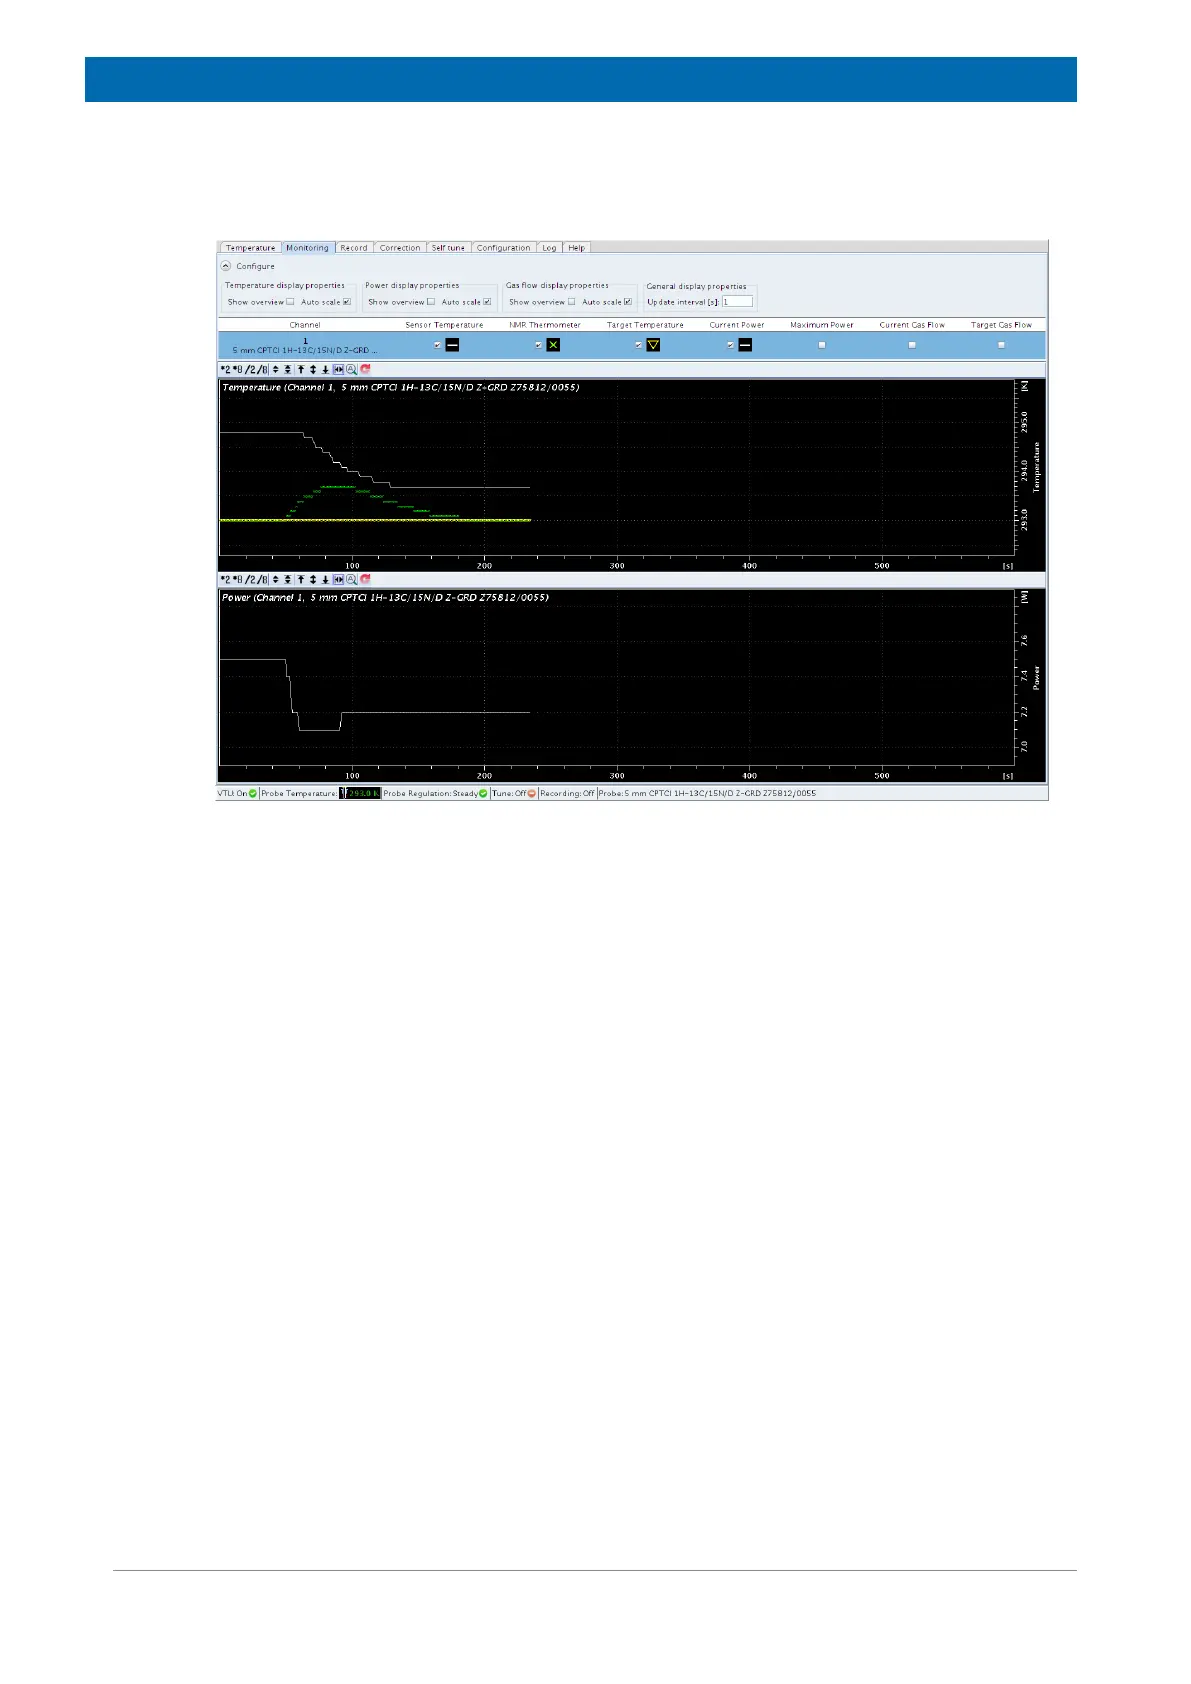
period of time and that the system immediately reacts to that by reducing the heater power
(figure below - lower part), and hence the sensor temperature (figure below - upper part,
white line).
Figure 4.12: Monitoring of the sensor and the sample temperature in edte during a TOCSY experiment
In the figure above, the upper part shows the temperature of the sensor and the NMR
Thermometers; the lower part shows the heater power.