Applications
30 Z33085_2_002
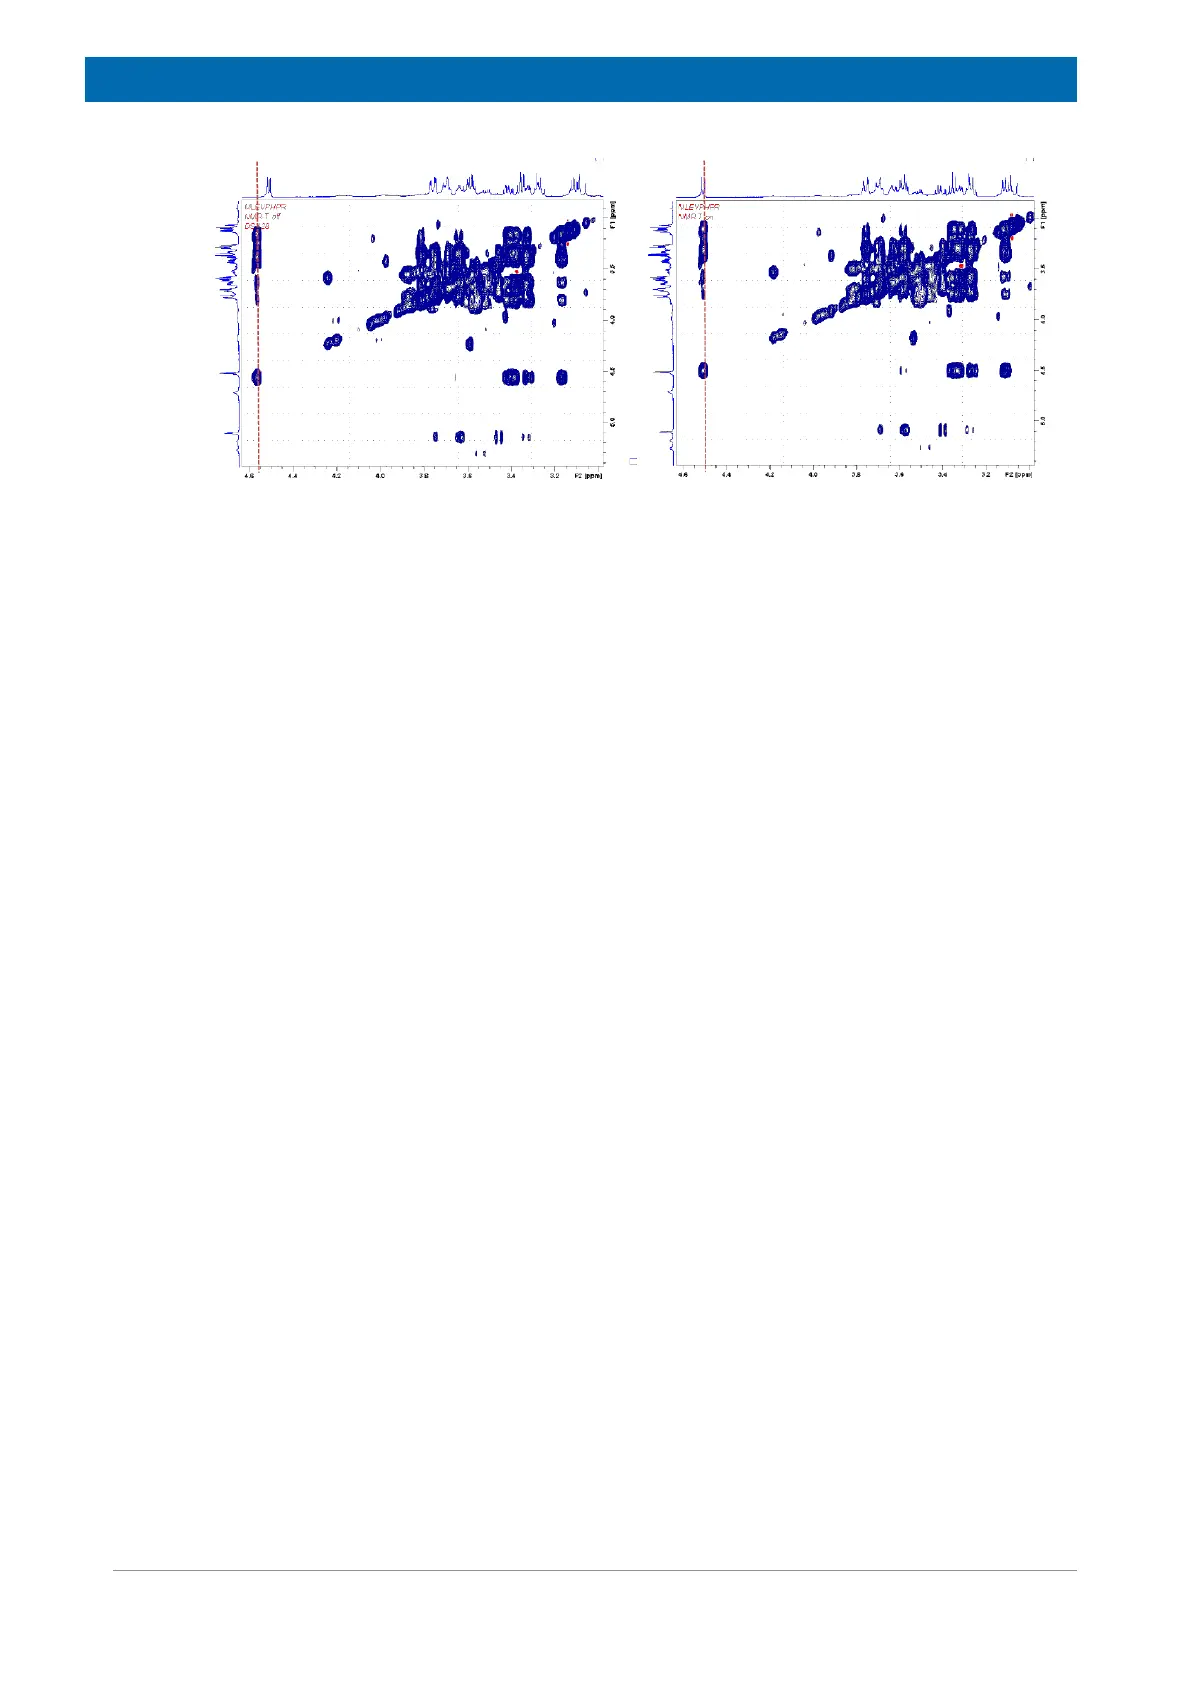
Figure 6.5: Comparison of TOCSY experiments of a liver sample with sodium acetate added measured
with HR-MAS at 4 kHz spinning speed.
In the figure above is a comparison of TOCSY experiments of a liver sample with sodium
acetate added measured with HR-MAS at 4 kHz spinning speed. The reference 1H spectrum
is plotted as projection. Left part: NMR Thermometer disabled (monitoring mode); Right part:
NMR Thermometer enabled (regulation mode).