EasyManuals Logo

Casio ALGEBRA FX 2.0 User Manual

Casio ALGEBRA FX 2.0
426 pages
To Next Page IconTo Next Page
To Previous Page IconTo Previous Page
Page #205 background imageLoading...
Page #205 background image
19990401
5-7-16
Using Tables
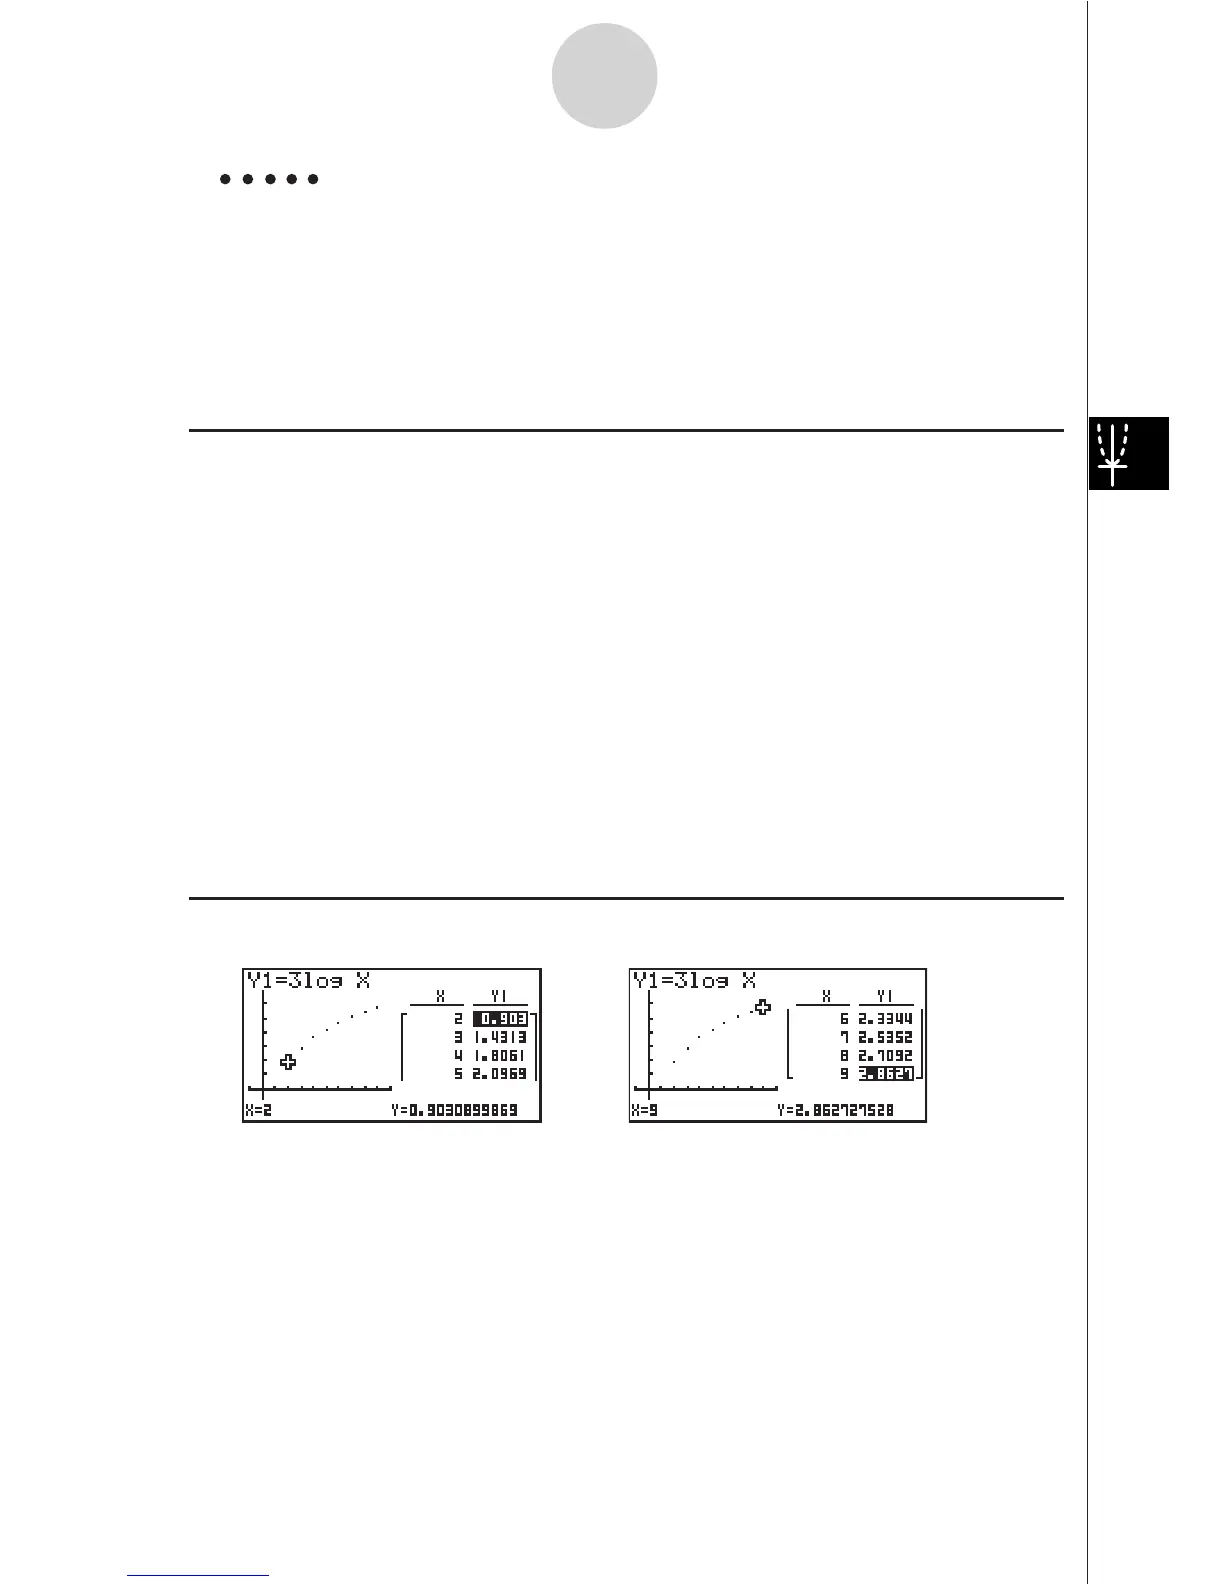
Example Store the function Y1 = 3logx and simultaneously display its number
table and plot-type graph. Use a table range of 2 through 9, with an
increment of 1.
Use the following V-Window settings.
Xmin = –1, Xmax = 10, Xscale = 1
Ymin = –1, Ymax = 4, Yscale = 1
Procedure
1 m GRPH
•
TBL
2 !K(V-Window)-bwbawbwc
-bwewbwi
u3(SET UP)ccc1(T+G)i
3 3(TYPE)b(Y=)dlvw
6(g)2(RANG)
cwjwbwi
4 5(TABL)
5(G
•
PLT)
5 6(g)4(G
•
Link)
6 c ~ c, f ~ f
Result Screen
…
$
%
…

Table of Contents

Other manuals for Casio ALGEBRA FX 2.0

Questions and Answers:

Question and Answer IconNeed help?

Do you have a question about the Casio ALGEBRA FX 2.0 and is the answer not in the manual?

Casio ALGEBRA FX 2.0 Specifications

General IconGeneral
BrandCasio
ModelALGEBRA FX 2.0
CategoryCalculator
LanguageEnglish

Related product manuals