19990401
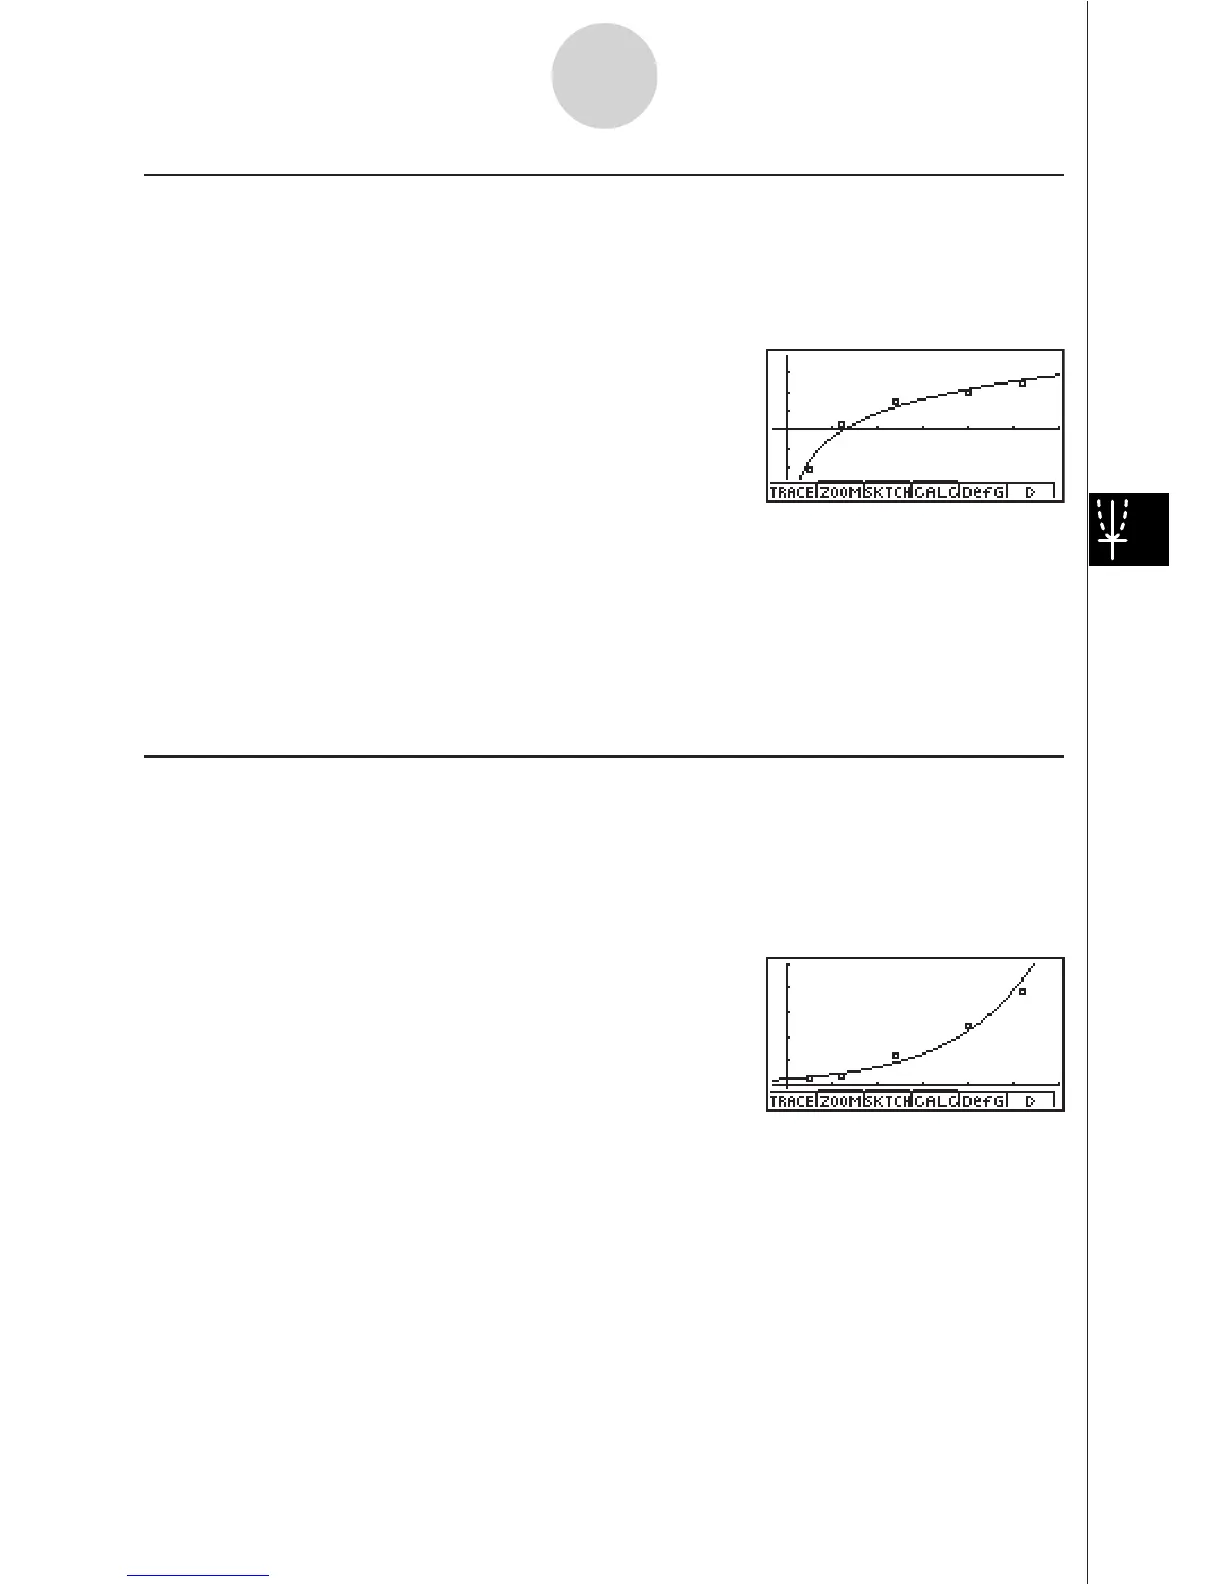
k Logarithmic Regression Graph
Logarithmic regression expresses y as a logarithmic function of x. The standard logarithmic
regression formula is y = a + b ! In x, so if we say that X = In x, the formula corresponds to
linear regression formula y = a + bX.
4(CALC)h(Log)
6(DRAW)
The following is the logarithmic regression model formula.
y = a + b
•
ln x
a .............
regression constant term
b ............. regression coefficient
r .............. correlation coefficient
r
2
............ coefficient of determination
k Exponential Regression Graph
Exponential regression expresses y as a proportion of the exponential function of x. The
standard exponential regression formula is y = a ! e
bx
, so if we take the logarithms of both
sides we get In y = In a + bx. Next, if we say Y = In y, and a = In a, the formula corresponds
to linear regression formula Y = a + bx.
4(CALC)i(Exp)
6(DRAW)
The following is the exponential regression model formula.
y = a
•
e
bx
a ............. regression coefficient
b ............. regression constant term
r .............. correlation coefficient
r
2
............ coefficient of determination
6-3-8
Calculating and Graphing Paired-Variable Statistical Data