19990401
kk
kk
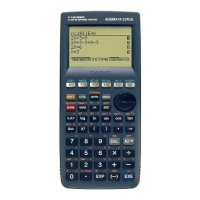
k Power Regression Graph
Power regression expresses y as a proportion of the power of x. The standard power
regression formula is y = a ! x
b
, so if we take the logarithms of both sides we get In y = In a +
b ! In x. Next, if we say X = In x, Y = In y, and a = In a, the formula corresponds to linear
regression formula Y = a + bX.
4(CALC)j(Power)
6(DRAW)
The following is the power regression model formula.
y = a
•
x
b
a ............. regression coefficient
b ............. regression power
r .............. correlation coefficient
r
2
............. coefficient of determination
kk
kk
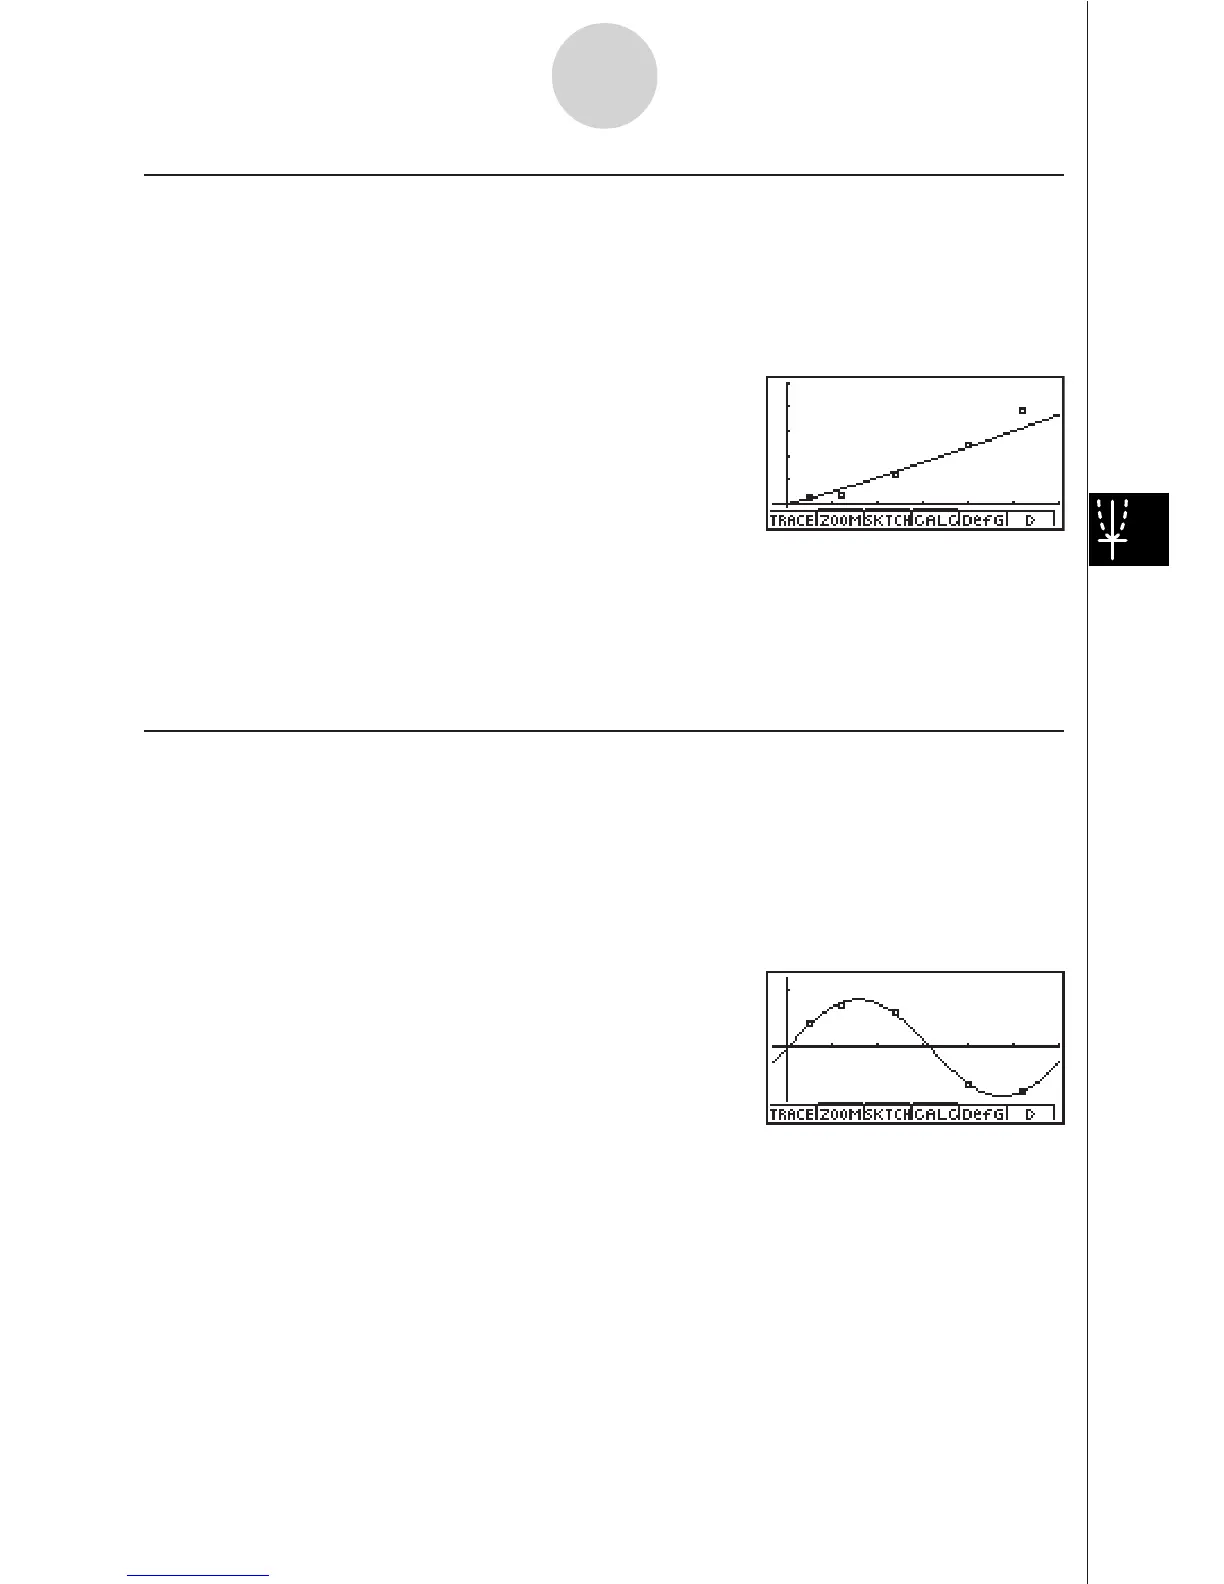
k Sinusoidal Regression Graph
Sinusoidal regression is best applied for cyclical data.
The following is the sinusoidal regression model formula.
y = a·sin(bx + c) + d
While the statistical data list is on the display, perform the following key operation.
4(CALC)v(Sin)
6(DRAW)
Drawing a sinusoidal regression graph causes the angle unit setting of the calculator to
automatically change to Rad (radians). The angle unit does not change when you perform a
sinusoidal regression calculation without drawing a graph.
• Certain types of data may take a long time to calculate. This does not indicate malfunction.
6-3-9
Calculating and Graphing Paired-Variable Statistical Data