19990401
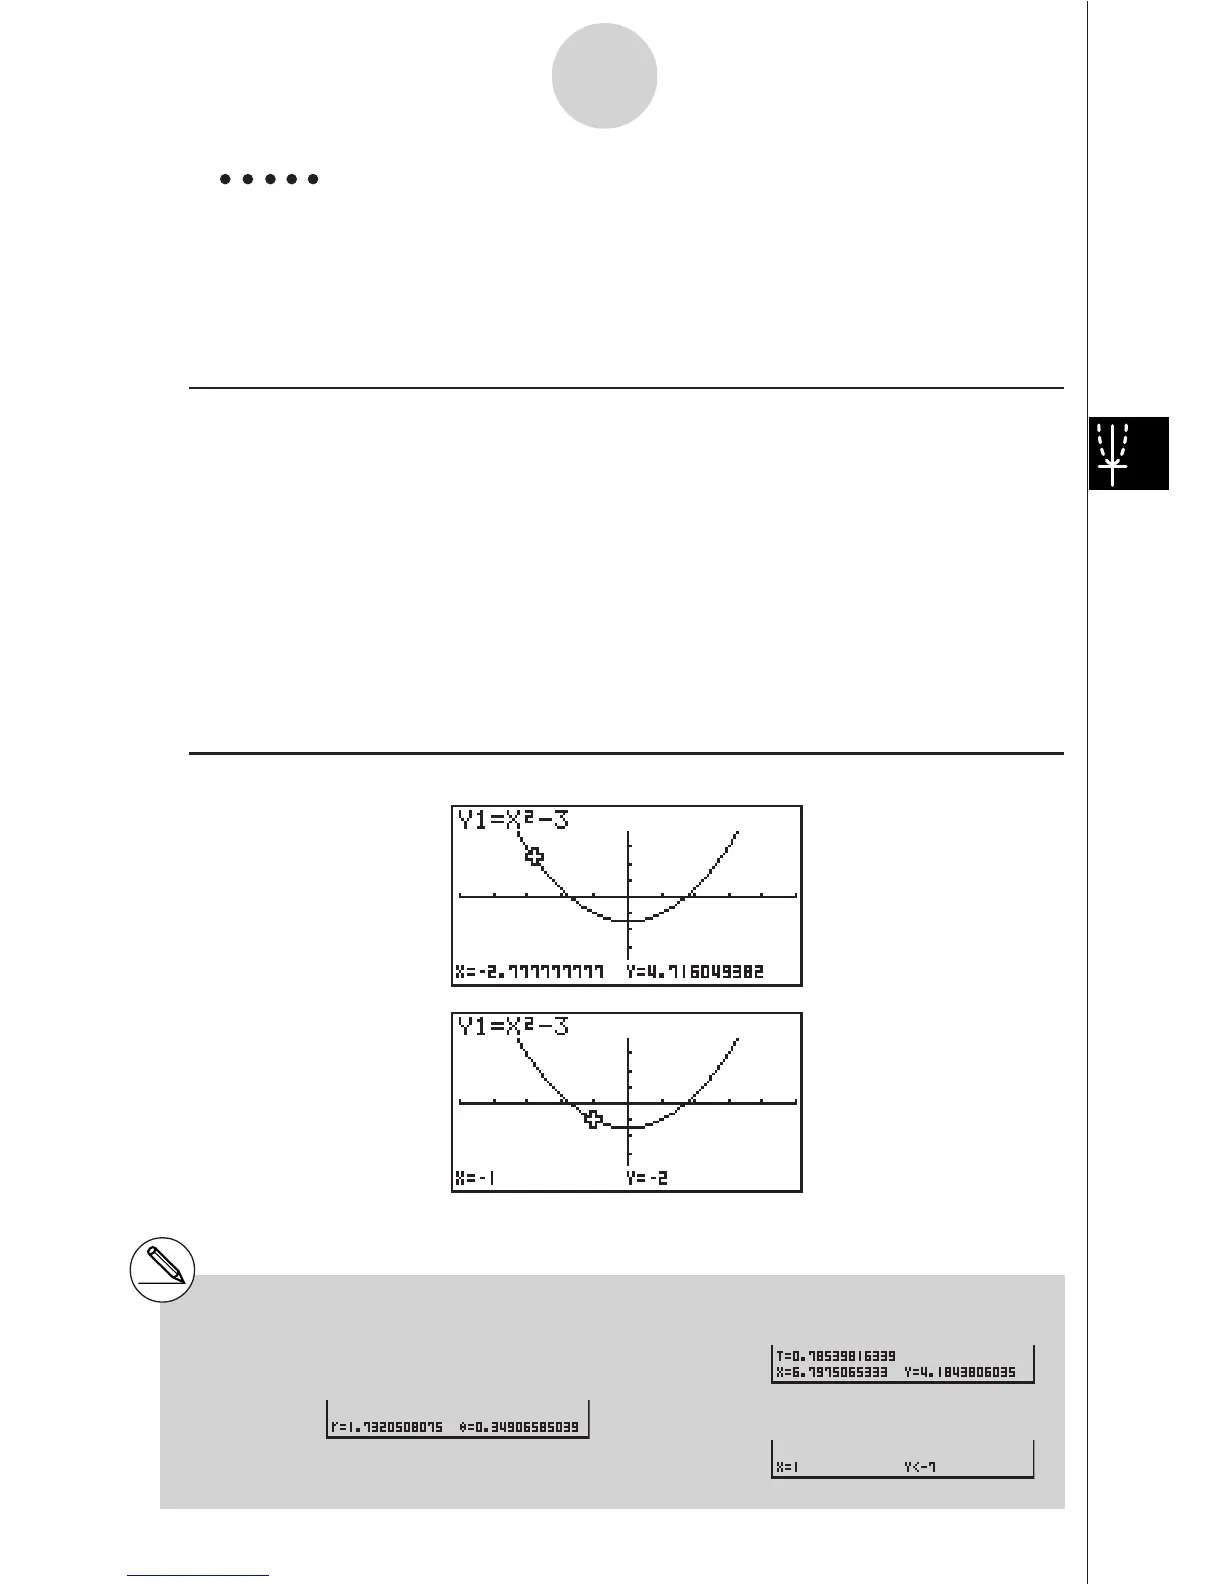
Example Read coordinates along the graph of the function shown below.
Y1 = x
2
– 3
Use the following V-Window settings.
Xmin = –5, Xmax = 5, Xscale = 1
Ymin = –10, Ymax = 10, Yscale = 2
Procedure
1 m GRPH
•
TBL
!K(V-Window) -fwfwbwc
-bawbawcwi
3(TYPE)b(Y=)vx-dw
5(DRAW)
2 1(TRACE)
3 d~d
4 v-bw
Result Screen
5-11-2
Function Analysis
# The following shows how coordinates are
displayed for each function type.
• Polar Coordinate Graph
•Parametric Graph
•Inequality Graph