19990401
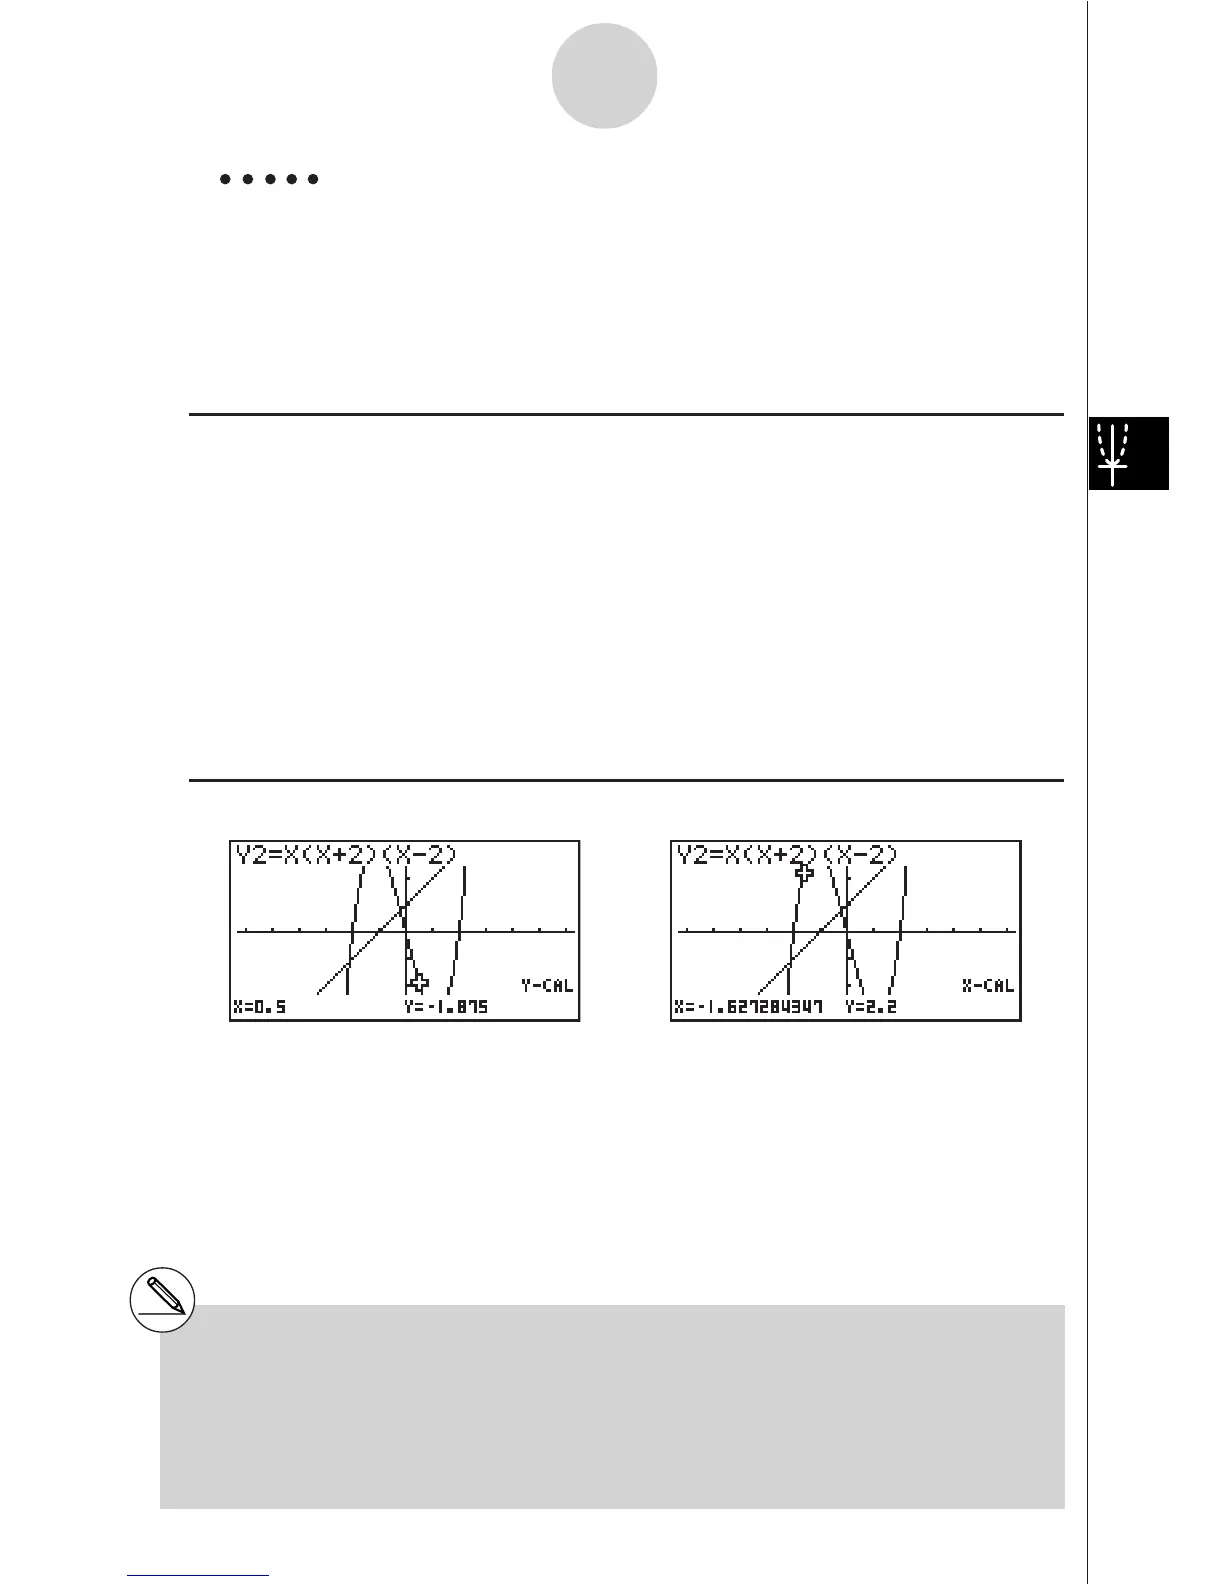
Example Graph the two functions shown below and then determine the y-
coordinate for x = 0.5 and the x-coordinate for y = 2.2 on graph Y2.
Y1 = x + 1, Y2 = x(x + 2)(x – 2)
Use the following V-Window settings.
Xmin = –6.3, Xmax = 6.3, Xscale = 1
Ymin = –3.1, Ymax = 3.1, Yscale = 1 (initial defaults)
Procedure
1 m GRPH
•
TBL
!K(V-Window) 1(INIT)i
3(TYPE)b(Y=)v+bw
v(v+c)(v-c)w
5(DRAW)
2 4(G-SLV)g(Y-Cal) 2 4(G-SLV)h(X-Cal)
3 cw 3 cw
4 a.fw 4 c.cw
Result Screen
5-11-14
Function Analysis
#When there are multiple results for the above
procedure, press e to calculate the next
value. Pressing d returns to the previous
value.
#Step 3 of the above procedure is skipped
when there is only one graph on the display.
# The X-Cal value cannot be obtained for a
parametric function graph.
#After obtaining coordinates with the above
procedure, you can input different coordinates
by first pressing v.