19990401
kk
kk
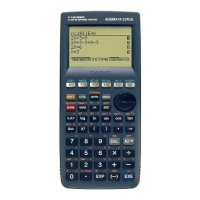
k Linear Regression Graph
Linear regression uses the method of least squares to plot a straight line that passes close to
as many data points as possible, and returns values for the slope and y - intercept
(y -coordinate when x = 0) of the line.
The graphic representation of this relationship is a linear regression graph.
4(CALC)c(Linear)
6(DRAW)
The following is the linear regression model formula.
y = ax + b
a ............. regression coefficient (slope)
b ............. regression constant term (intercept)
r ............. correlation coefficient
r
2
............ coefficient of determination
kk
kk
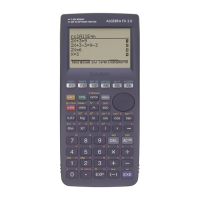
k Med-Med Graph
When it is suspected that there are a number of extreme values, a Med-Med graph can be
used in place of the least squares method. This is similar to linear regression, but it
minimizes the effects of extreme values.
4(CALC)d(MedMed)
6(DRAW)
The following is the Med-Med graph model formula.
y = ax + b
a .............
Med-Med graph slope
b ............. Med-Med graph intercept
6-3-6
Calculating and Graphing Paired-Variable Statistical Data
#Input a positive integer for frequency data.
Other types of values (decimals, etc.) cause
an error.