20070201
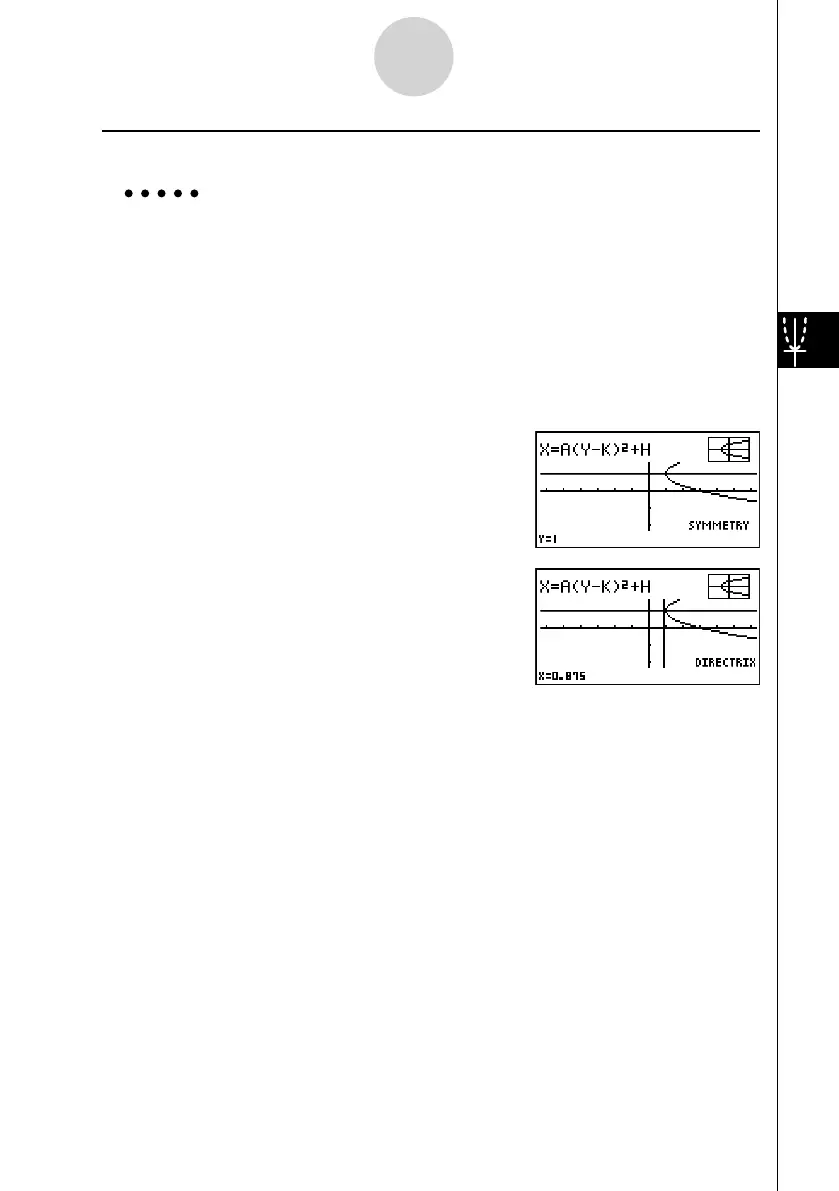
u To draw and analyze the axis of symmetry and directrix
[G-SLV]-[SYM]/[DIR]
Example To draw the axis of symmetry and directrix for the parabola
X = 2(Y – 1)
2
+ 1
Use the following V-Window settings.
Xmin = –6.3, Xmax = 6.3, Xscale = 1
Ymin = –3.1, Ymax = 3.1, Yscale = 1 (initial defaults)
m CONICS
w
c w b w b w6 (DRAW)
!5 (G-SLV)
2 (SYM)
(Draws the axis of symmetry.)
!5 (G-SLV)
3 (DIR)
(Draws the directrix.)
5-11-21
Function Analysis